
You’re tracking market share. You’re hitting sales targets. But you feel like you’re flying blind, always reacting instead of leading.
The problem isn’t your sales data. It’s that you’re looking in the rearview mirror.
Share of Market (SOM) is your report card. It tells you what percentage of total sales you already captured. It’s a lagging indicator.
Share of Voice (SOV) is your crystal ball. It measures how much of the conversation in your market you own right now. It’s a leading indicator that predicts future growth.
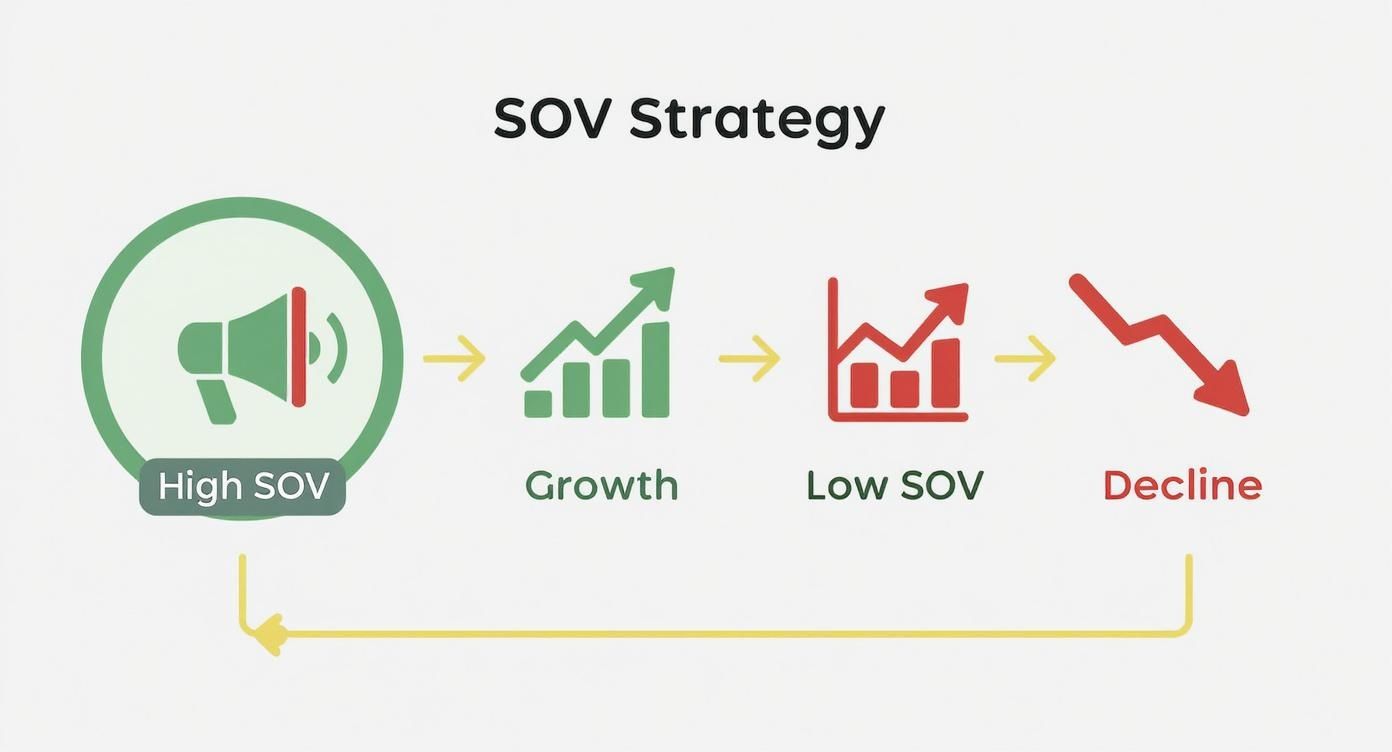
If your SOV is higher than your SOM, you’re probably going to grow. If it’s lower, you’re about to lose ground. It’s that simple.
Your Place in the Market: Past Performance vs. Future Potential
Most companies are obsessed with their share of market. It’s a clean, bottom-line metric that answers the question, "How much of the pie do we have today?"
But only tracking SOM is like trying to drive a car by only looking at where you’ve been.
Share of voice gives you the forward-looking view. It measures your brand's presence across the channels that matter—social media mentions, organic search visibility, podcast features, and ad impressions. It’s a core part of effective brand positioning.
A brand’s share of voice today often becomes its share of market tomorrow.
The key insight: A high SOV builds brand salience. It means when a customer is ready to buy, your name is the first one that comes to mind. This mental availability is the engine of market share growth.
Let's break down the metrics side-by-side.
Share of Market vs. Share of Voice at a Glance
This table shows how SOM and SOV compare on the most important attributes.
| Attribute | Share of Market (SOM) | Share of Voice (SOV) |
|---|---|---|
| What It Measures | Percentage of total sales revenue or unit sales in a category. | Percentage of brand conversation and online visibility vs. competitors. |
| Time Focus | Lagging Indicator (reports on past performance). | Leading Indicator (predicts future growth). |
| Primary Data | Sales figures, revenue reports, official market data. | Keyword rankings, social mentions, ad impressions, press features. |
| Strategic Goal | To capture a larger slice of existing customer spending. | To capture a larger slice of audience attention and consideration. |
One is rooted in financial history. The other is all about future potential through brand presence.
How to Calculate These Metrics Without Lying to Yourself
A good strategy needs accurate data. The formulas for share of market vs share of voice look simple, but the real work is in gathering honest numbers. Get this wrong, and your marketing plan will point in the wrong direction.
Calculating Share of Market
The formula is straightforward:
SOM = (Your Company's Sales / Total Market Sales) x 100
The tricky part is finding a reliable number for "Total Market Sales."
- For public companies: Use industry reports from Gartner, Forrester, or competitor financial filings.
- For private markets: This is harder. You’ll need to combine data from trade associations, government statistics, and private market research.
The most important thing is consistency. Once you define your total addressable market, stick with that definition. This ensures you're measuring progress against a stable benchmark, not a moving target.
Calculating a Modern Share of Voice
Forget the old ad-spend model. Today, SOV is about your brand's presence across the entire digital conversation.
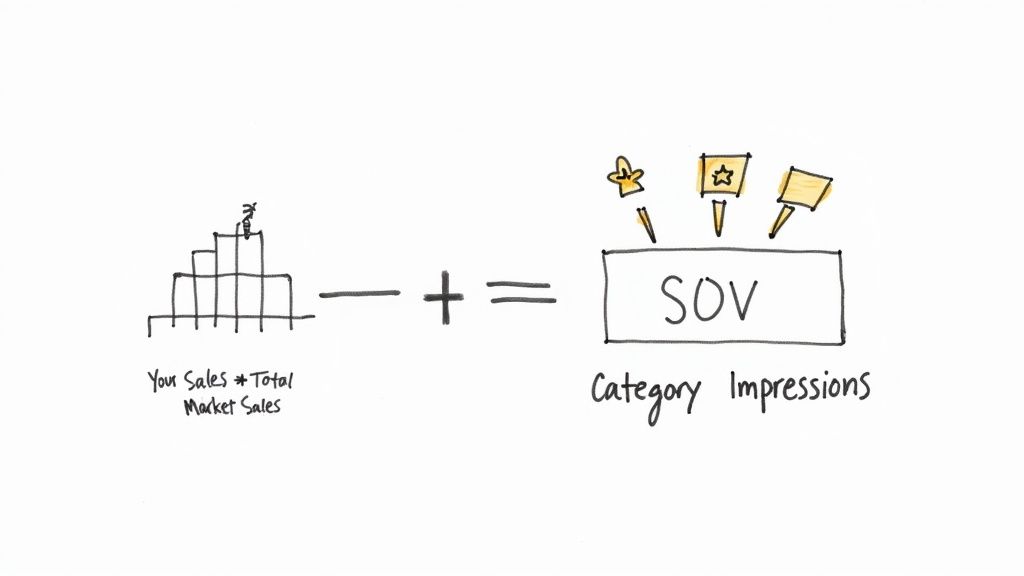
SOV = (Your Brand's Visibility / Total Market Visibility) x 100
You need to calculate this for the channels your audience actually uses.
- Organic Search (SEO): Track your visibility for a core set of non-branded keywords against your top competitors. Tools like Ahrefs and Semrush provide a "share of voice" metric based on keyword rankings and search volume. This is your visibility on Google.
- Paid Search (PPC): Google Ads makes this easy with its "Impression Share" metric. If your impression share is 40%, it means your competitors own the other 60% of ad views for those keywords.
- Social Media & PR: Monitor brand mentions, relevant hashtags, and key conversations across platforms like LinkedIn, X, and industry blogs. Use a dedicated share of voice calculator or monitoring tools like Brand24 to automate this.
Mini Case Study: A B2B SaaS Startup A project management tool, "FlowState," wants to measure its SOV. They track mentions on G2, Capterra, Reddit, and key industry blogs.
- FlowState Mentions: 500 per month.
- Total Market Mentions (FlowState + 3 main competitors): 4,000 per month.
- Their SOV: (500 / 4,000) x 100 = 12.5%. They now have a benchmark to beat. For a detailed guide, see this post on how to calculate Share of Voice for your brand.
Why Your SOV Is a Growth Engine for Market Share
The relationship between these two metrics is one of the strongest predictors of your company's future.
It boils down to a simple rule: if your SOV is higher than your SOM, you’re positioned for growth. If it’s lower, you're on track to lose ground.
This gap is called Excess Share of Voice (ESOV). It's the difference between how much people talk about you versus how much they buy from you. A positive ESOV is a clear signal that your market share is likely to increase.
You're "out-shouting" your current market position. This builds brand salience, ensuring you're top-of-mind when customers are ready to purchase.
The Proven Link: 10% ESOV = 0.5% Market Share Growth
This isn't just a theory. Research from analysts Les Binet and Peter Field, detailed by the IPA, found a direct statistical link.
Their findings show that for every 10 percentage points of ESOV a brand earns, it can expect an average market share growth of 0.5% per year. So if your brand has a 15% SOM but you capture a 25% SOV, that +10% ESOV gives you a measurable growth advantage. You can dig deeper into this data at Talkwalker.com.
This principle provides a clear framework: investing in visibility directly fuels bottom-line results.
The Danger of a Negative ESOV
The flip side is a critical warning sign. When your SOV drops below your SOM, you have a negative ESOV. This means competitors are dominating the conversation and grabbing your potential customers' attention.
Left unchecked, this almost always leads to market share erosion.
- Challenger Brand (Positive ESOV): A fintech startup has a tiny 2% market share but earns a 10% SOV through aggressive content and PR. That +8% ESOV helps it consistently acquire new users, driving steady growth.
- Established Leader (Negative ESOV): A legacy software company with a 40% SOM slashes its marketing budget. Its SOV falls to 25%. This -15% ESOV creates an opening for rivals to steal attention and, ultimately, customers.
By monitoring your ESOV, you can turn your marketing share of voice from a simple metric into a powerful strategic tool.
Setting Realistic SOV Benchmarks (Stop Chasing Unicorns)
Trying to define a single “good” Share of Voice number is a mistake. A 15% SOV might dominate a crowded market but mean you're invisible in a niche with three players.
Your goal is to set benchmarks that make sense for your specific industry.
Why SOV Varies So Much Between Industries
- Competitive Density: A market with two giants (Coke vs. Pepsi) has huge SOV numbers for both. A fragmented market with dozens of competitors means a smaller slice is a realistic win.
- Sales Cycle Length: Enterprise software sales are long. The SOV game isn't about being the loudest; it's about targeted, educational content that nurtures leads over months.
- Regulatory Constraints: Industries like pharmaceuticals or finance have strict rules that cap the volume of conversation, creating different SOV dynamics.
- Product Launch Cadence: Tech and auto brands see massive SOV spikes around new releases. Their benchmarks must account for these peaks and valleys.
Your industry's DNA shapes its conversational patterns. Stop comparing your SOV to brands in different markets. Dig into the norms of your own competitive space.
Benchmarks from Major Sectors
Real-world data shows how wildly these SOV targets swing. In consumer packaged goods (CPG), leaders often hold a steady SOV between 10% and 30%.
Contrast that with Apple, which can command SOV spikes of 30% to 50% during a product launch. Established auto brands like Toyota typically cruise with an SOV between 15% and 30%. You can find more data on how SOV correlates with market leadership on Umbrex.com.
The only way to win is to analyze your direct competitors to define a benchmark that makes sense for you.
Real-World Examples: How SOV Strategy Creates Winners and Losers
Theory is one thing. Seeing it play out is another. The link between share of voice and share of market has direct consequences.
Let's look at two realistic scenarios. One brand got it right, one got it wrong.
Mini Case Study 1: The Challenger Brand That Won with Niche SOV
A new B2B fintech startup, "FinPal," enters a crowded market with a tiny 1% share. The big players have massive ad budgets. A head-to-head fight is impossible.
So FinPal got smart with a hyper-focused SOV strategy.
- The Channels: They ignored mainstream financial news. Instead, they went all-in on two niche subreddits (r/fintech and r/smallbusiness), collaborated with specific LinkedIn influencers, and got featured on key fintech podcasts.
- The Goal: Achieve 50%+ SOV in these specific channels, even if their overall market SOV stayed small.
- The Tactics: They actively answered questions in Reddit threads, co-hosted podcast episodes on industry pain points, and gave influencers exclusive data for their content.
Within six months, FinPal owned the conversation where their ideal customers spent time. Their total market SOV only nudged up to 4%, but their visibility in these high-impact channels was off the charts. This drove a flood of qualified leads, tripling their market share to 3% in one year.
The Lesson: You don't need to be the loudest voice everywhere. Dominating the conversation in a few critical niche channels drives real growth much faster than a broad, underfunded campaign.
Mini Case Study 2: The Incumbent That Lost by Neglecting SOV
"DuraTools," a legacy hardware brand, had a comfortable 35% market share. Their strategy was mostly TV spots and print ads. They didn't track digital SOV.
A younger competitor, "BuildRight," started with 5% SOM but poured their budget into "how-to" videos on YouTube and TikTok. They partnered with DIY influencers and built a massive library of tutorials that ranked for project-specific searches.
Over two years, BuildRight's SOV in the "DIY project help" space shot up to over 40%. DuraTools was nowhere. When customers needed project guidance, they found BuildRight. That constant presence built trust.
DuraTools started bleeding market share, losing 2-3% annually. They were still the bigger company by revenue, but they were no longer part of the conversation. Their brand was becoming a relic.
A Practical Playbook to Increase Your Share of Voice
Knowing you need to boost your SOV is the easy part. Building a plan that moves the needle is where most brands get stuck. Focus on three core domains where visibility translates into future market share.
1. Own the Answers with Content and SEO
Your content is the bedrock of your digital SOV. The goal isn't just ranking; it's owning the definitive answers to your customers' biggest questions.
- Map the entire customer problem. Go beyond surface-level keywords to uncover every question your audience asks.
- Build definitive pillar content. For each core problem, create a comprehensive resource that is better than anyone else's. This becomes a magnet for backlinks and authority.
- Dominate organic visibility. Strong organic rankings are a direct, measurable reflection of your SOV.
2. Go Where the Conversation Is: Social and Community
Conversations about your market are happening with or without you. Your job is to find the important ones and become a valuable contributor.
Don’t just join conversations; start them. Posing thoughtful questions and sharing unique insights positions you as a leader.
Get active in niche communities—specific subreddits, focused LinkedIn groups, or industry forums. This targeted SOV is often more valuable than broad, generic visibility. To see how competitors are winning these conversations, check out these competitive intelligence strategies.
3. Win the Next Frontier: AI and LLMs
The next wave of brand discovery is happening inside generative AI. When a user asks ChatGPT or Gemini for a recommendation, your brand needs to be in the answer. This is the new frontier for SOV.
To win here, you must make it simple for AI models to parse and trust your website's information. Structure content with clear data, build detailed comparison pages, and fill the content gaps your competitors have left open. If you're not monitoring your brand's presence in AI answers, you're risking your future market share.
Your Questions, Answered
Here are quick answers to the most common questions about share of market vs share of voice.
Is it better to have a high SOM or a high SOV?
A high Share of Market (SOM) means you're winning today. It's proof of past performance.
A high Share of Voice (SOV) is a preview of future growth. A healthy business needs both, but if your goal is growth, your SOV should always be higher than your SOM.
How often should we measure these metrics?
The right cadence depends on your industry.
- Share of Market (SOM): Measure this quarterly or annually. Market-level sales data is slow to compile.
- Share of Voice (SOV): Measure this monthly or even weekly. Online conversations and competitor campaigns move fast. You need fresh data to adjust your strategy.
Can a small brand with a low budget compete on SOV?
Absolutely. Strategy beats budget. Stop trying to be loud everywhere and start being dominant somewhere specific.
A small brand can own the SOV in a specific subreddit, a key industry podcast, or among a handful of influential bloggers. This targeted visibility drives more qualified leads than a broad, underfunded campaign ever could. Be a big fish in a small pond.
Ready to see how your brand shows up in AI-generated answers? The battle for future market share is being won and lost in LLMs. With AI SEO Tracker, you can monitor your AI Share of Voice across ChatGPT, Gemini, and more, turning conversational visibility into a measurable growth engine. Get started at https://aiseotracker.com.
