Your brand’s visibility against competitors is measured by share of voice (SOV). If your industry's conversation is a pie, SOV is the size of your slice. It's a direct look at your brand awareness and a strong predictor of future market share.
But most brands measure it wrong, leaving a massive blind spot where customers are making decisions now: AI search.
Why Share of Voice Is Your Most Honest Metric
Vanity metrics are everywhere. Follower counts and website traffic can paint a misleading picture. They don't tell you how you're really doing against the competition where it counts—in the minds of your customers.
Share of voice cuts through the noise. It’s your most critical benchmark.
SOV isn't about being the loudest; it's about earning the most relevant attention. It tells you exactly how much of the conversation your brand owns. If your market share is 10% but your SOV is only 3%, you are vulnerable. It’s a red flag that your competitors are outmaneuvering you, capturing mindshare, and setting themselves up for growth at your expense.
The Proven Link Between Visibility and Growth
Marketers have always known that being seen more leads to selling more. This isn't just a gut feeling; it's a proven model based on Excess Share of Voice (ESOV). This happens when your SOV is higher than your current market share.
A brand that consistently maintains a higher share of voice than its market share is building the foundation for growth. It's a leading indicator of future success.
Research by Les Binet and Peter Field established a direct link. Their findings, analyzing hundreds of campaigns, showed that for every 10 points of ESOV a brand achieves, it can expect a 0.5% increase in market share per year.
This provides a clear model for budgeting and proves that brand marketing translates directly into revenue. You can find more on these findings in Nielsen’s breakdown of the topic.
To make this clear, the table below breaks down the relationship between SOV and market share.
SOV vs. Market Share At a Glance
| Scenario | SOV vs. Market Share | Predicted Outcome |
|---|---|---|
| Growth Mode | SOV > Market Share (ESOV) | Market share is likely to increase. You're building brand momentum. |
| Stagnation | SOV ≈ Market Share | Market share will likely remain stable. No growth, no decline. |
| Danger Zone | SOV < Market Share | Market share is at high risk of decreasing. Competitors are winning attention. |
Simply matching your market share isn't enough for growth. You have to punch above your weight to get ahead.
A Tale of Two Coffee Shops
Imagine two local coffee shops, "The Daily Grind" and "Artisan Beans," both holding roughly 20% of the local market.
-
The Daily Grind pours its budget into direct-response ads, like "buy one, get one free" coupons. They're only visible when they're actively selling something, so their SOV is a meager 10%.
-
Artisan Beans, however, plays the long game. They invest in community events, get featured in local food blogs, and run an engaging Instagram account. Their SOV climbs to 30%.
Right now, their market share is identical. But Artisan Beans is building mental availability. When people in town think "coffee," they think of Artisan Beans first.
This Excess Share of Voice (30% SOV vs. 20% market share) positions them to capture the next wave of customers. The Daily Grind is left fighting for scraps with temporary discounts.
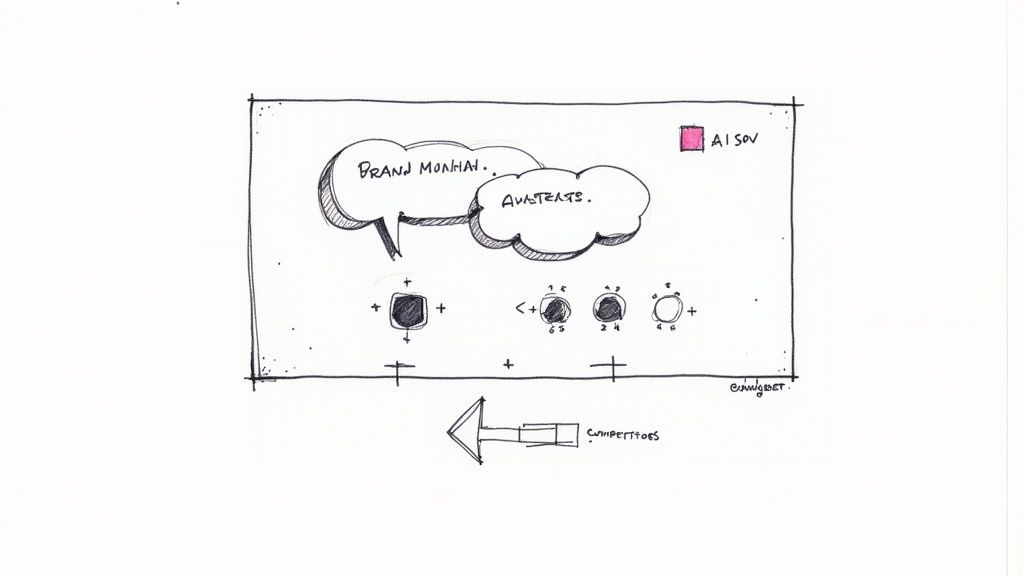
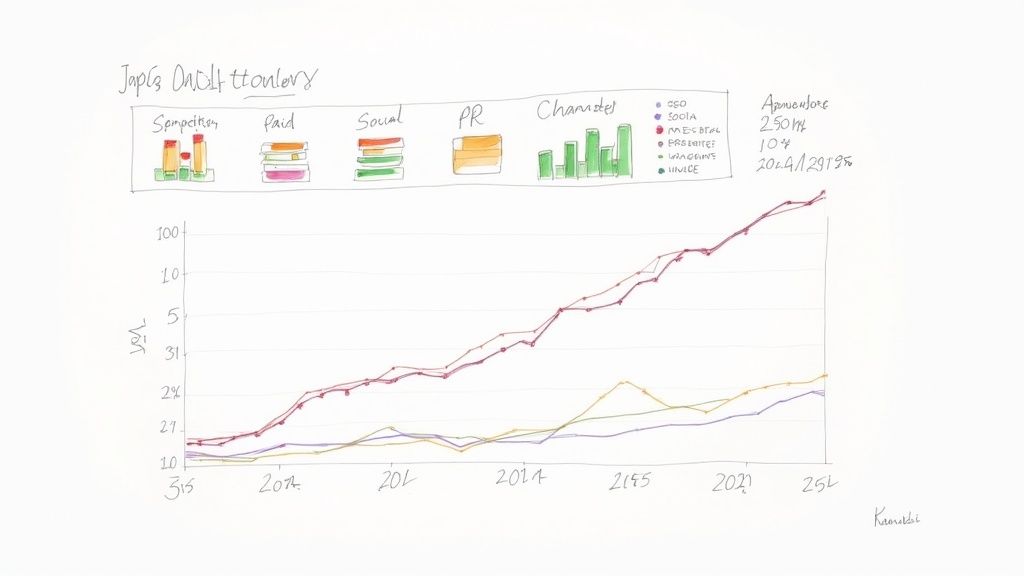
How to Calculate Your True Share of Voice Across Channels
Calculating your marketing share of voice isn't a one-size-fits-all task. If you only track social media mentions, you have a dangerously incomplete picture. You have to measure your visibility on every front where customers form opinions.
The core formula is simple in theory but messy in practice.
![]()
This idea highlights a fundamental truth: brands that consistently punch above their weight are the ones that grow. Your calculation must adapt to different channels to capture this full picture.
The Universal Share of Voice Formula
The basic math for Share of Voice is straightforward: (Your brand metrics ÷ Total market metrics) × 100.
If there were 10,000 social media mentions about energy drinks last month and your brand got 2,500 of them, your SOV is 25%. In competitive markets, average SOV often hovers between 10% and 30%, with market leaders aiming to stay consistently above 20%.
This formula is your starting line. The real work is applying it correctly to each channel.
Measure Your SOV in Organic Search
For most brands, organic search is the biggest piece of the puzzle. You're not just counting mentions; you're measuring your real estate on the search engine results page (SERP).
To calculate this, track:
- Keyword Rankings: How many of your target keywords rank on page one compared to your competitors?
- Search Visibility: What percentage of all possible organic clicks are you capturing for a specific set of keywords? Tools like Ahrefs or Semrush provide a "Visibility" score for this.
- Impression Volume: How often your domain appears in search results for tracked keywords.
Your organic SOV is your search visibility score divided by the total visibility of all competitors you track.
Calculate Your Share in Paid Media
With paid channels like Google Ads, the metric is much more direct: Impression Share.
Impression Share is the percentage of impressions your ads received compared to the total number they could have received. An Impression Share of 60% means you appeared in 60 of every 100 potential ad slots.
This tells you exactly how much ad space you own for your target keywords. It also flags if you're losing out because your budget is too low or your ad rank is poor, giving you a clear path to fix it.
Find Your Voice in Social Media and PR
On social media, the game shifts from impressions back to conversations. Here, you’ll track mentions, branded hashtags, and overall engagement. You need tools like Brandwatch or Meltwater to pull this data together.
The SOV calculation looks like this:
- Your Brand Mentions: All direct (@) and indirect mentions of your brand.
- Total Industry Mentions: Mentions of your brand plus those of all your defined competitors.
Public Relations SOV runs on a similar logic. You track how many articles or media placements your brand gets versus your top competitors. The key is to define a set list of relevant publications to make it an apples-to-apples comparison.
For more detail on the math, see our guide to share of voice calculation.
Mini Case Study: A Niche SaaS vs. The Market Leader
Imagine a new project management SaaS called "FlowState" trying to compete with a giant like Asana.
- Asana targets broad keywords like "project management software," where it has a massive 70% organic SOV.
- FlowState knows it can't win that fight. Instead, it focuses on a specific niche: "project management for creative agencies." By creating hyper-targeted content, FlowState hits a 40% SOV within that niche.
While FlowState's overall market SOV is a rounding error, its niche SOV is dominant. This proves that winning a specific, profitable conversation is more valuable than being a whisper in a crowded stadium.
Don’t Forget to Measure SOV in AI and LLM Answers
The marketing landscape is shifting. Your audience doesn't just use Google; they ask AI chatbots for recommendations. If your brand isn't mentioned in those AI-generated responses, your hard-won marketing share of voice is quietly eroding.
Welcome to the new frontier: AI Share of Voice (AI SOV).
This isn't a future trend—it's happening now. AI SOV measures your brand's presence within the answers generated by Large Language Models (LLMs) like ChatGPT, Perplexity, and Google's AI Overviews. If you're not tracking it, you're becoming invisible to a growing segment of your market.
Define the AI SOV Calculation
Unlike traditional channels, AI SOV isn't about keywords or impression share. It’s about being the cited, recommended solution inside a conversational answer.
The core formula adapts to this new context:
AI SOV = (Your Brand Mentions in AI Answers / Total Brand Mentions in AI Answers) x 100
To make this work, you must define your competitive set and the "conversational battlefield"—the specific, high-intent prompts your customers use. This means shifting from short keywords like "CRM software" to full-sentence questions like "what's the best CRM for a small sales team?"
For instance, a travel site needs to track its mentions for prompts like "best websites for affordable international flights" across multiple AI platforms, comparing its AI SOV to Expedia and Kayak.
Measuring AI SOV is non-negotiable. It's the only way to know if your brand exists in the primary discovery channel for the next generation of buyers. A drop in organic traffic might be the symptom; a zero percent AI SOV is the disease.
The Practical Steps for Tracking AI SOV
Manually tracking your AI SOV is nearly impossible. LLM answers are dynamic and personalized. You need a specialized approach and the right tools.
- Identify High-Intent Prompts: Think like your customer. What questions do they ask when they’re ready to buy? Brainstorm prompts starting with "what is the best...," "how do I solve...," and "compare X and Y for..."
- Define Your Competitors: List the top 3-5 brands you directly compete with to keep measurement focused.
- Automate the Tracking: Use a dedicated tool like AI SEO Tracker to monitor these prompts across different LLMs at scale.
- Analyze the Sources: This is the most critical step. Understand why an AI mentions a brand by analyzing its cited sources. This reveals which articles, reviews, or data points are influencing its recommendations.
Understanding the "why" is your key to improving your standing. Explore the best citation analysis options for optimizing AI search to build a stronger content strategy.
Mini Case Study: How a B2B SaaS Found its AI Blind Spot
A cybersecurity company, "SecureCloud," noticed a gradual decline in demo requests from organic search. Their keyword rankings were stable. They were a well-known brand but couldn't pinpoint the leak.
They tracked their AI SOV for 20 high-intent prompts like "best cloud security platform for startups."
The results were alarming.
SecureCloud's AI SOV was a dismal 5%. Their main competitor, "CyberArmor," dominated with a 45% AI SOV. The reason was clear after analyzing the citations: CyberArmor was consistently referenced in third-party comparison guides and "best of" listicles from 2023. SecureCloud's best content was from 2021. AI models favored the more recent sources.
This insight allowed SecureCloud to launch a targeted campaign to update old content and get featured in new guides, directly influencing the AI's source material. Understanding the underlying ChatGPT ranking factors is also crucial for improving your SOV in these environments.
Actionable Strategies to Increase Your Marketing SOV
Knowing your share of voice is the diagnosis. Now it’s time for the treatment. Increasing your marketing share of voice requires a deliberate effort to not just join conversations, but to own them.
This isn’t about brute force. It's about being smarter and more strategic.
Dominate Organic Search with Definitive Content
To win in organic search, your content must be the primary source of truth for a topic—the kind of asset that both people and AI models trust.
- Publish Original Research: Stop curating information and start creating it. A B2B software company could survey 1,000 professionals and publish an annual "State of the Industry" report. This instantly makes your brand the source.
- Create "Hub" Content: Build comprehensive resource hubs that cover a topic from every angle. A pillar page like "The Ultimate Guide to Remote Team Management" signals deep authority.
- Target "Best X for Y" Queries: These are high-intent keywords where people are looking for recommendations. Create detailed, honest comparison pages that evaluate your product against competitors.
By creating definitive content, you become the reference point for your entire industry.
Own the Conversation on Social Media
Social media SOV isn’t about posting frequency. It’s about steering the most important conversations in your niche.
The brand that controls the narrative gets the attention. Don't just join conversations—start them. Ask provocative questions and host expert panels.
For example, a fintech company could launch a weekly LinkedIn Live series debating the future of digital payments, featuring guests from other firms. This positions them as a central hub for thought leadership, not just another vendor.
Amplify Your Voice Through Strategic PR
High-authority media mentions have a compounding effect on your SOV. A single feature in a top-tier publication can be more powerful than a hundred blog posts.
Ultimately, these strategies are about improving brand awareness and making your brand more memorable.
- Data-Driven Pitches: Use your original research to pitch journalists. A headline like "New Study Finds 78% of CMOs Plan to Increase AI Spending" is far more compelling than a product announcement.
- Executive Thought Leadership: Position your leaders as the go-to experts for industry commentary. Build relationships with journalists long before you need them.
- Newsjacking with a Twist: When a trend hits, offer a unique, counterintuitive take. If everyone is talking about the benefits of a new technology, write about its hidden risks. That contrarian angle helps you stand out.
A Look at Different Growth Tactics
Boosting your SOV requires a channel-specific plan. Each platform needs a different approach.
| Channel | Primary Tactic | Key Metric to Track |
|---|---|---|
| Organic Search (SEO) | Creating definitive "hub" content and original research. | Percentage of top-3 rankings for target commercial keywords. |
| Social Media | Initiating industry-wide conversations with branded hashtags. | Branded vs. unbranded mention volume. |
| Public Relations (PR) | Securing media placements with data-driven stories. | Number of mentions in Tier 1 publications. |
| Paid Media | Targeting competitor brand names with comparison ads. | Impression share for competitor keywords. |
| Content Marketing | Publishing guest posts on high-authority industry sites. | Referral traffic from placements; number of new backlinks. |
A balanced approach creates a powerful flywheel effect. PR wins boost your SEO authority, social conversations fuel content ideas, and paid ads amplify your best assets.
Case Study: A B2B Software Turnaround
A B2B project management tool, "SyncUp," had a stagnant 8% SOV in a crowded market. They were being outspent by bigger competitors.
They rolled out a focused, 12-month strategy.
- Original Research: They published "The 2024 Productivity Deficit Report," a deep dive into how modern teams waste time. The report was downloaded over 5,000 times and earned 50+ backlinks.
- Targeted Podcast: They launched "The Agency Ops" podcast, aimed at creative agency owners. By featuring sought-after guests, they built a loyal following.
- Hyper-Focused LinkedIn Campaign: They used data from their report to run a targeted LinkedIn ad campaign, sparking debates around team productivity.
The result? Within one year, SyncUp's marketing share of voice shot up from 8% to over 20%. They didn't increase their budget; they focused their efforts on creating assets that owned a specific conversation.
Build Your SOV Tracking Dashboard
Tracking your marketing share of voice consistently turns it from a vanity metric into a strategic weapon. A simple, effective dashboard organizes your data and reveals the trends that matter.
The goal is a single source of truth that clearly communicates progress.
Select the Right Tools for Each Channel
You can't measure everything with a single tool. A solid SOV dashboard pulls data from specialized platforms.
Your core toolkit should include:
- Social Listening (Brandwatch or Meltwater): Essential for tracking brand mentions, sentiment, and conversation volume on social media.
- Organic Search (Ahrefs or Semrush): To measure SEO share of voice, you need to track keyword visibility. Ahrefs' "Share of Voice" metric directly calculates your visibility against rivals.
- Paid Media (Google Ads): The built-in Impression Share metric is the purest form of SOV for paid search.
- AI Answers (AI SEO Tracker): A specialized tool to track how often your brand is cited in response to high-intent prompts on platforms like ChatGPT.
Design Your Monthly SOV Report
Your report needs to tell a story at a glance. Stakeholders need to see trends and understand the bottom-line impact.
A powerful monthly report includes:
- Overall SOV Trend: A line chart showing your total SOV month-over-month.
- Competitive Landscape: A bar chart comparing your SOV against your top 3-5 competitors.
- Channel-Specific Breakdown: Charts showing your SOV for Organic, Social, Paid, and AI.
- Key Wins & Insights: A short, bulleted list explaining why the numbers changed (e.g., "Our research report drove a 15% lift in PR mentions").
The real value of monitoring share of voice comes from watching how it evolves. Is your SOV growing or stuck? This is where data becomes actionable.
Connect SOV to Real Business Outcomes
Ultimately, share of voice only matters if it helps you grow. Overlay your SOV data with core business metrics to demonstrate its ROI.
Share of Voice measurement must extend beyond social media mentions to include pay-per-click advertising, web traffic, and media coverage. When measured consistently and compared to competitors, it becomes a powerful strategic guide.
Knowing Tesla holds 21.1% of the industry conversation versus BMW's 26.6% provides immediate context. You can see more insights like this from EmbedSocial's SOV benchmarks.
Start mapping your SOV trends against:
- Website Traffic: Does an increase in organic SOV lead to a lift in organic traffic?
- Lead Generation: When your social SOV spikes, do you see a corresponding rise in demo requests?
- Sales Revenue: Over the long term, does a sustained increase in SOV correlate with a rise in market share?
By drawing these lines, you transform SOV from an abstract concept into a tangible predictor of business success.
Common Share of Voice Questions Answered
Here are practical answers to the questions marketers actually ask when putting share of voice theory into practice.
What Is a Good Share of Voice to Aim For?
Forget a single "good" number. It’s all relative to your market position.
The most powerful rule of thumb is to aim for a share of voice higher than your current market share. This principle is called Excess Share of Voice (ESOV), and it's a reliable leading indicator for growth.
- For a Market Leader: If you own 35% of the market, keeping your SOV in the 30-40% range is a strong defensive move.
- For a Challenger Brand: With 5% market share, hitting a 10% SOV is a huge win. That imbalance creates the pressure needed to chip away at bigger competitors.
Stop chasing a generic percentage and start focusing on achieving ESOV.
How Often Should I Measure Share of Voice?
Consistency beats frequency. For most businesses, measuring SOV monthly or quarterly is the sweet spot.
Monthly tracking is tactical. It lets you see the immediate splash from specific campaigns.
Quarterly reporting is more strategic. It gives you a high-level view of market dynamics, smoothing out random noise. It's perfect for long-term planning.
Don't measure daily. The daily swings are almost always noise, not signal. It's a recipe for reactive, bad decisions.
Can a Small Business Compete on Share of Voice?
Absolutely. But you can't win by being louder. You have to win by being smarter. Redefine the battlefield.
Instead of fighting for the entire market’s attention, dominate a specific niche.
- Bad Strategy: A boutique coffee roaster trying to win the SOV for "coffee." They’ll be drowned out by Starbucks.
- Good Strategy: That same roaster decides to own the conversation for "single-origin espresso for home baristas."
In that smaller pond, a small business can punch way above its weight. They can achieve a high SOV through hyper-targeted content and focused community building.
Your advantage isn't budget; it's focus.
Ready to measure your brand's presence in the new era of AI search? AI SEO Tracker is the only platform built to show you exactly where you stand in answers from ChatGPT, Perplexity, and more. Stop guessing and start winning the high-intent prompts that drive revenue.