
Ever get that nagging feeling your competitors are everywhere? It’s a common gut check for marketers, but without data, it’s just anxiety. Share of Voice (SOV) is the metric that turns that feeling into a number.
Think of it as the percentage of the market conversation you own. It's a direct measure of your brand’s visibility against everyone else, and frankly, it’s a leading indicator of where your market share is headed.
First, Understand the Basic Formula
At its core, the calculation is refreshingly simple. You divide your brand's performance on a specific metric by the total market performance for that same metric.
SOV = Your Brand Metric / Total Market Metric
Let’s make that real. Say your brand got 1,500 social media mentions last month. After tracking your top competitors, you find the total mentions for all key brands in your space (including yours) was 7,500.
1,500 / 7,500 = 0.20
Your share of voice is 20%. You own one-fifth of the conversation. Simple.
This requires two clear inputs: your metric and the total market metric.
SOV Calculation Components
| Component | What It Is | Example |
|---|---|---|
| Your Brand Metric | Your brand's count for a specific KPI. | 1,500 social media mentions in Q3. |
| Total Market Metric | The combined total of your metric plus the same metric for all relevant competitors. | 7,500 total industry mentions in Q3. |
The real power of SOV isn't the number itself; it’s tracking it over time. A rising SOV confirms your marketing is working. A dip is an early warning that a competitor is gaining ground.
This data-driven approach is critical as user behavior shifts. For instance, understanding your visibility within the AI search market is crucial for staying relevant. By consistently calculating SOV, you move from guessing to knowing.
Stop Tracking Everything—Define Your Battlefield First
Before you calculate a single number, you need to draw a line in the sand. Trying to measure your Share of Voice across "the entire internet" is a recipe for useless data.
Specificity is your best friend here. The goal isn't to boil the ocean; it's to get an actionable number that reflects your actual market.
Who Are You Really Competing Against?
First, get honest about who you're up against. Don't just list the industry giants. Pick 3–5 direct competitors—the ones actively solving the same problem for the same customer. This includes the scrappy upstart who might be stealing your audience right now.
Zero In on the Channels That Matter
Once you know the players, you have to choose the arena. Not all channels are created equal. Focus on where your customers actually make decisions.
- An e-commerce clothing brand? Their SOV on Instagram and TikTok probably predicts sales.
- A B2B SaaS company? They’ll care more about organic search visibility for keywords like "best project management software."
Trying to track everything creates noise. Pick the 2-3 primary channels where conversations genuinely impact your bottom line. This keeps the process manageable and meaningful.
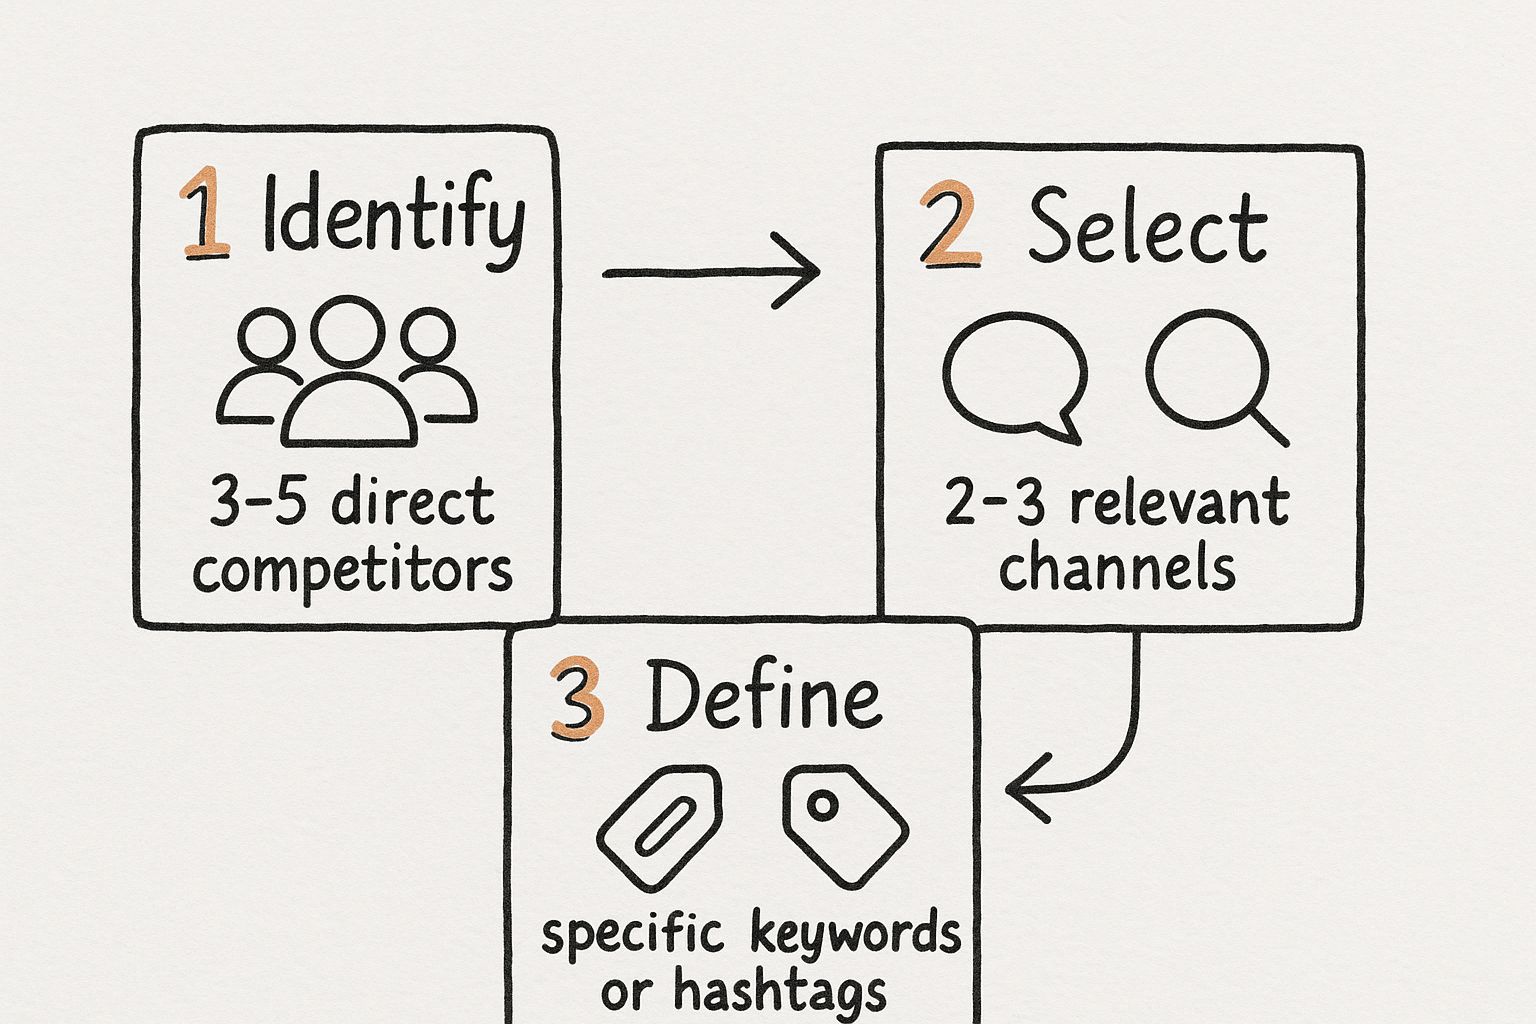
As you can see, the path moves from broad competition to specific, measurable metrics. This is what makes your final SOV number something you can act on.
Mini Case Study: A B2B Software Company's Focus
A project management tool called "FlowState" wants to calculate its SOV against heavyweights like Asana and Monday.com, plus a fast-growing rival, ClickUp.
Instead of a vague analysis, they get specific:
- Competitors: Asana, Monday.com, and ClickUp.
- Channels: Organic Search and LinkedIn.
- Metrics: For search, they track visibility across a core list of 20 high-intent keywords. For LinkedIn, they track brand mentions and engagement on posts using the
#ProjectManagementhashtag.
This tight scope gives them a clear, strategic number. They aren't distracted by chatter on platforms that don't matter to their bottom line.
How to Calculate SOV Manually (Without Fancy Tools)
You don’t need an expensive subscription to get a handle on your Share of Voice. A scrappy, manual approach using Google and a spreadsheet is enough to get a directional metric today.
This isn't about perfect accuracy. The goal is a consistent, repeatable process to spot trends. Consistency beats complexity. Use the exact same search process, for the same time period, every time you measure.
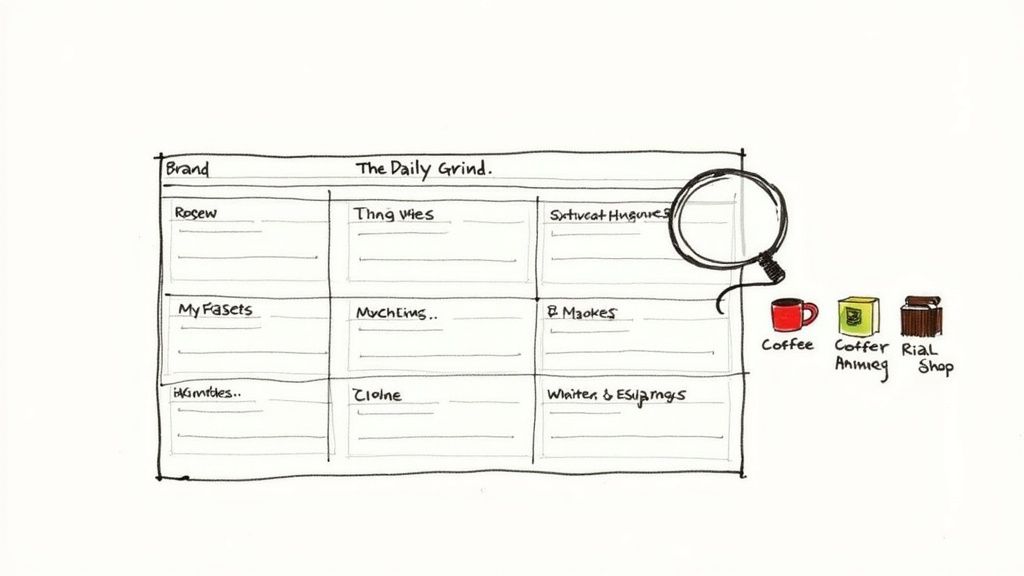
Mini Case Study: A Coffee Shop's Weekly Check-In
Imagine a local coffee shop, "The Daily Grind," competing against three local rivals: Brew & Bloom, The Corner Perk, and Urban Espresso. Their goal: track brand mentions across Google News and Instagram over one week.
Here’s the simple process they followed:
- Gather Google Data: They used Google's search tools, setting the time filter to "Past Week" and searching each brand's name in quotes (e.g.,
"The Daily Grind Coffee") in the News tab. They noted the number of results. - Search on Social: Next, they did the same on Instagram, searching hashtags like
#TheDailyGrindCoffeeand tagged posts. They tallied relevant public mentions from the past week for all competitors. - Organize in a Spreadsheet: All data went into a simple spreadsheet to calculate the total market mentions and each brand's slice of the pie.
The Simple Calculation in Action
After gathering data for one week, their spreadsheet looked like this:
| Brand | Google News Mentions | Instagram Mentions | Total Mentions |
|---|---|---|---|
| The Daily Grind | 8 | 32 | 40 |
| Brew & Bloom | 15 | 65 | 80 |
| The Corner Perk | 5 | 25 | 30 |
| Urban Espresso | 2 | 18 | 20 |
| Total Market | 30 | 140 | 170 |
Now, they plug the numbers into the SOV formula for The Daily Grind:
(Your Mentions / Total Market Mentions) x 100 = SOV %
(40 / 170) x 100 = 23.5%
Just like that, The Daily Grind knows it has a 23.5% Share of Voice for that week. More importantly, they see that Brew & Bloom is the leader with a 47% share, giving them a real competitive benchmark to target.
Key takeaway: Manual tracking isn't about perfect precision. It’s about establishing a consistent baseline so you can measure the impact of your marketing. If The Daily Grind runs a PR campaign, they can repeat this process to see if the number moved.
While the manual process is crucial to understand, some tools can automate this. A dedicated Share of Voice Calculator can be handy for a quick calculation.
Manual vs. Automated: The Tradeoffs
Choosing between manual tracking and an automated tool comes down to budget, time, and the detail you need.
| Aspect | Manual Calculation (Google & Spreadsheets) | Automated Tools (e.g., Brandwatch, Semrush) |
|---|---|---|
| Cost | Free (just your time) | Paid subscriptions |
| Setup Time | Minimal; start immediately | Requires setup and learning curve |
| Data Scope | Limited to channels you manually check | Comprehensive (web, social, news) |
| Accuracy | Directional; prone to human error | High; uses algorithms for data collection |
| Speed | Slow and labor-intensive | Fast; near-real-time data |
| Best For | Small businesses, quick snapshots, budget constraints | Larger businesses, in-depth analysis |
Starting manually teaches you the fundamentals before you invest in a sophisticated platform.
Measure What Matters: SEO Share of Voice
When most people hear "Share of Voice," they think social media. That's a mistake. One of the most powerful ways to use SOV is in organic search.
Your SEO Share of Voice isn't about mentions; it’s about visibility. It tells you how often your brand shows up on the search engine results page (SERP) for the keywords that drive your business. This is a direct measure of valuable impressions that influence traffic and revenue.
From Mentions to Market Visibility
To get your SEO SOV, you shift from tracking conversations to tracking search performance data. The goal is to find the percentage of all possible impressions your brand is capturing for a specific keyword list.
The formula is a twist on the classic:
SOV (SEO) = Your Brand's Impressions / Total Search Volume for Keywords
You need two key data points, likely from a tool like Semrush or Ahrefs:
- Your Impressions: How many times your site appeared for your target keywords (often called "Traffic" or "Visibility" in SEO tools).
- Total Search Volume: The combined monthly search volume for that same keyword set.
B2B Software Example Revisited
Let's say a CRM company wants to dominate the conversation around "sales automation." Their first move is to identify 50 high-value keywords their ideal customers search for.
First, they calculate the total market size. They add up the monthly search volume for all 50 keywords and find the total is about 250,000 searches per month. This is their total addressable search market.
Next, they check their own performance. Using an SEO tool, they see that over the last month, their website captured an estimated 37,500 impressions from that exact keyword list.
Now for the math:
37,500 Impressions / 250,000 Potential Impressions = 15% SEO Share of Voice
This 15% figure is far more useful than a social mention count. It gives the marketing team a concrete number representing how much of the relevant search market they own. Now they can track AI in Search Console for an even deeper view and explore proven strategies to boost your Share of Voice SEO to own more of that SERP real estate.
You Have Your Number. Now What?
Okay, you did the math. The real work starts now. On its own, that number is just data. The goal is to turn it into a decisive marketing strategy.
Think of your SOV as a diagnostic tool. A declining number is an early warning flare—a competitor is getting aggressive. A rising number is confirmation that your efforts are working. It tells you exactly where you stand.
If Your Share of Voice is Low
A low SOV isn't a failure. It’s a map showing you where the opportunities are. Instead of a scattergun approach, you can be surgical.
- Attack a Competitor's Blind Spot: Does a competitor dominate social media but is invisible in search? Perfect. That’s your opening. Pour resources into SEO and capture the SERP real estate they’ve ignored.
- Launch a Pinpoint Campaign: Use your SOV insights to justify a targeted content campaign. If a rival owns the conversation on a key feature, create the definitive guide or case study that challenges their dominance and steals the spotlight.
If Your Share of Voice is High
A high SOV means you're leading the conversation. It also means you have a target on your back. Your strategy must pivot from offense to defense.
A high Share of Voice isn’t a finish line; it’s a territory you must actively defend.
Defending your position means doubling down on what’s working while watching for new challengers. Is a smaller competitor gaining traction with a new message or channel? Analyze their tactics and adapt your strategy to neutralize the threat before they gain ground. This proactive monitoring is how you stay on top.
Why the “simple” SOV formula isn’t enough
Raw mentions divided by total mentions can look scientific and still mislead you. A spike in SOV driven by negative press or off-topic chatter is not a win—sentiment, relevance, and authority matter as much as volume. Pair any SOV percentage with context (channel, time window, and qualitative review) before you bet the budget on it.
For SEO specifically, measure impressions or visibility for a defined keyword set—not a vague global mention count. Break SOV down by social, organic search, and paid when those channels matter to your business; blending them into one number usually hides where you’re actually losing.
Excess Share of Voice (ESOV) and monitoring
ESOV is the gap between your share of voice and your current market share. When SOV runs ahead of share of market, sustained growth is more likely—this is why tracking SOV quarterly (or monthly during a launch) beats one-off snapshots. Use the same competitor list and channels each time so the trend line is comparable.
FAQs About Share of Voice
A few nuances can trip people up. Let's tackle the most common questions.
How often should I calculate it?
Quarterly is the sweet spot for most brands. It’s frequent enough to catch important trends without getting bogged down in daily fluctuations. If you’re in a big product launch or a major campaign, checking monthly provides faster feedback on whether your efforts are moving the needle.
What is a good Share of Voice percentage?
The honest answer: it depends. There’s no magic number. Your target SOV is relative to your market. In a crowded industry, a 15% SOV could make you the leader. In a market dominated by two giants, grabbing 10% would be a massive win. Focus on steady, consistent growth against your direct competitors. As Nielsen data showed, a 10-point difference between SOV and Share of Market (SOM) can lead to 0.5% of market share growth.
Can I calculate SOV for a specific product?
Absolutely—and you should. Instead of tracking your whole brand, you track mentions, keywords, and impressions tied only to that one product and its direct competition. This gives you a sharper, more actionable picture of where each product stands.
Your Next Steps
- Define your battlefield: List your top 3-5 direct competitors and the 2-3 channels where your customers make decisions.
- Choose your metric: Decide if you’re tracking mentions, impressions, or another specific KPI.
- Calculate your baseline: Run the numbers for the last 30 days to get your starting SOV.
- Set a goal: Aim to increase your SOV by a realistic percentage next quarter.
- Repeat: Make this a regular part of your marketing reporting.
Ready to see your brand's visibility in the new era of search? AI SEO Tracker shows you exactly where you stand in LLM-generated answers. Discover your AI Share of Voice and get an action plan to dominate the results in ChatGPT, Gemini, and more. Start tracking your AI visibility today.
