

TL;DR
- Definition: Your ad spend ÷ all ad spend in the category.
- In Google Ads: it's called impression share. Auction insights shows it for competitors.
- The limit: impression share is not category share of voice. Its total is smaller.
- Why it matters: 10 extra points of voice went with 0.5 to 0.7 points of market share a year.
Does AI name your brand? Check your site.
Advertising share of voice is simple.
Your ad spend. Divided by all the ad spend in your category.
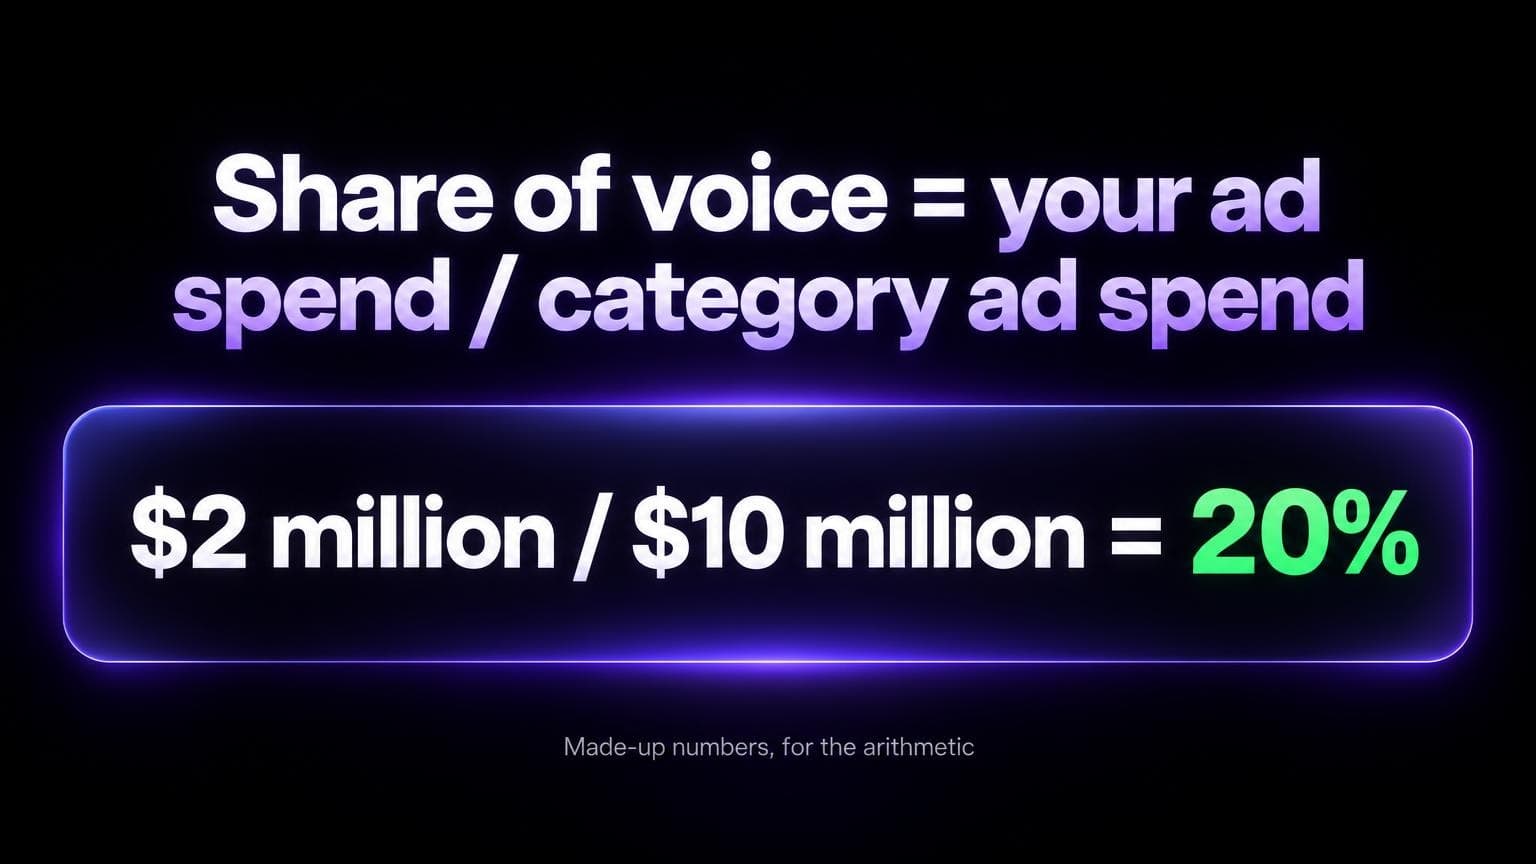
You spend $2 million. The category spends $10 million. Your share of voice is 20%.
Why care? Studies link a share of voice above your market share to growth.
But there's a catch. Your ad dashboard shows a different number.
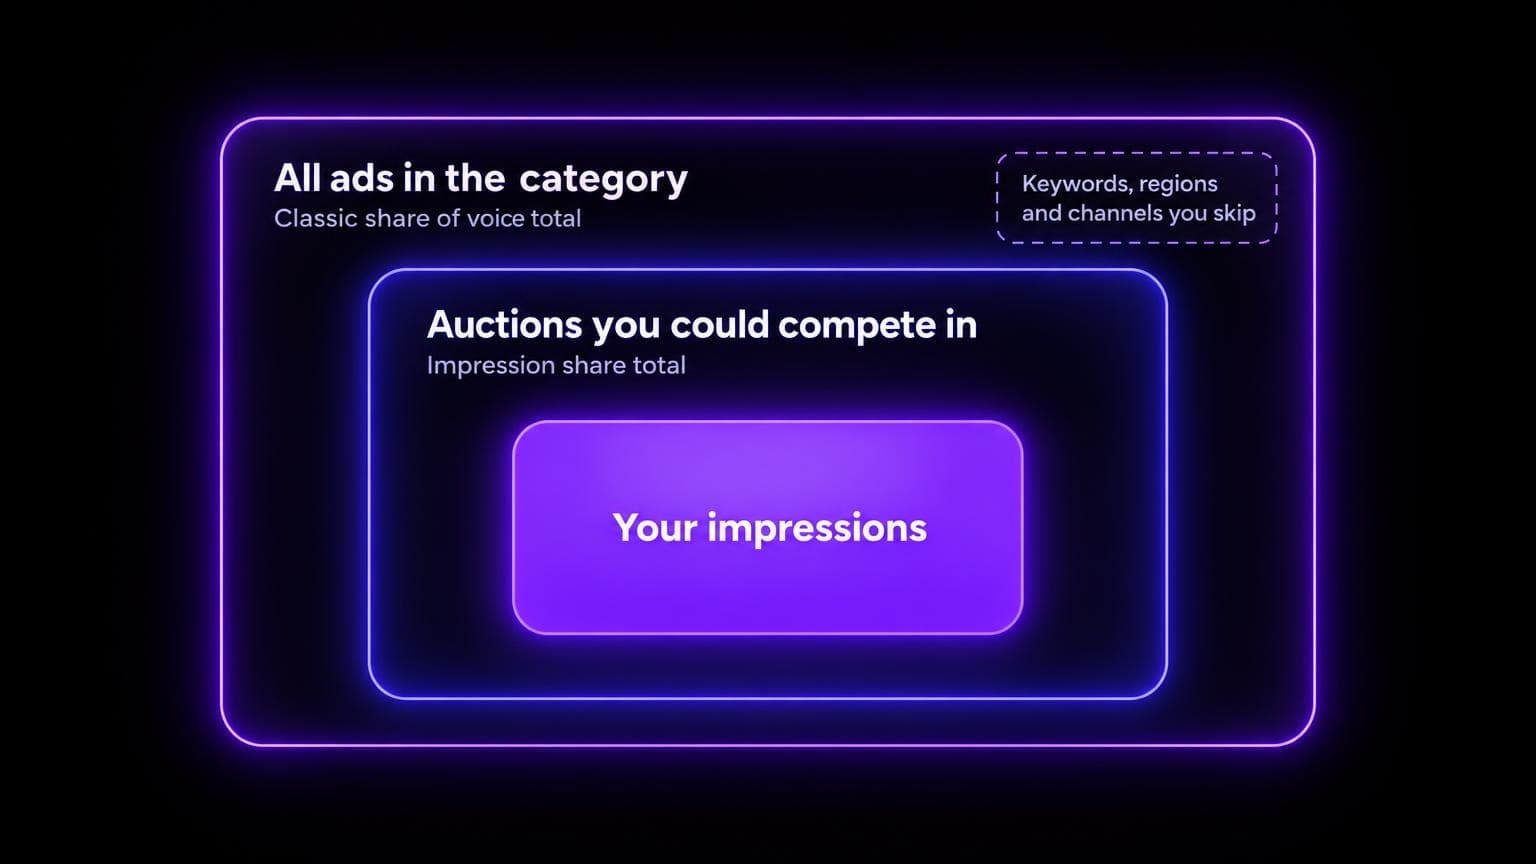
Google Ads calls it impression share. And its total is only the auctions you could compete in. Not the market.
Here's the formula, four ways to measure it, how to read impression share, and what the research says.
(Formulas across channels: how to calculate share of voice.)
What Is Advertising Share of Voice
Classic share of voice counts money.
Share of voice = your ad spend ÷ category ad spend × 100
| Your ad spend | Category ad spend | Your share of voice |
|---|---|---|
| $2 million | $10 million | 20% |
(Numbers here are made up for the arithmetic, unless a source is named.)
Two definitions from the people who study it:
- Nielsen: a brand's media spending as a percentage of all media expenditures in the category. In that market, on that channel, at that point in time. (March 2025.)
- Les Binet and Peter Field: typically defined as a brand's share of all category advertising expenditure.
Nielsen adds a limit. Share of voice doesn't measure the impact of a campaign. It shows whether the campaign has the means to compete.
Not everyone counts money.
- Google Ads counts impressions.
- A billboard or a publisher counts slots. Wikipedia describes that sense as the share of ad inventory available to one advertiser.
Three Share of Voice Numbers and Their Totals
People mix up three numbers.
Each divides by a different total. So each answers a different question.
| Number | Its total | Use it to |
|---|---|---|
| Spend share | All advertising spend in the category | Compare with market share and set a budget target |
| Google Ads impression share | The auctions Google estimates you could compete in | Find lost reach in your own campaigns, from budget or rank |
| Slot share | All slots in the loop or on the placement | Know how much of a sponsorship or billboard you hold |
Google estimates eligible impressions from targeting settings, approval statuses and quality, among other factors.
Keywords you don't bid on? Not in the total. Regions you don't target? Not in the total.
So a brand can hold a high impression share on twenty keywords. And still be a small voice in its category.
The report can't show that.
Four Ways to Measure Advertising Share of Voice
| Method | Formula | Data source |
|---|---|---|
| Spend share | Your ad spend ÷ category ad spend | Your invoices and an ad intelligence vendor |
| Impression share | Impressions ÷ eligible impressions | Google Ads or Microsoft Advertising, in the account |
| Share of search | Searches for your brand ÷ searches for all brands in the category | Google Trends, free |
| Keyword share of voice | Your clicks ÷ all clicks on a tracked keyword list | A rank tracker |
Spend share
You know your own spend. Not a competitor's.
- Paid data: Nielsen Ad Intel sells advertising spend data across TV, digital, social, audio, print, out-of-home and cinema.
- Free ad libraries: they help less than they seem to. Google's Ads Transparency Center lists the ads an advertiser has served. Meta says its Ad Library gives spend and reach for ads about social issues, elections or politics.
Share of search
Binet presented share of search at the IPA's EffWorks Global conference on 14 October 2020.
It measures demand. Not advertising.
Keyword share of voice
Ahrefs Rank Tracker calculates it from the clicks your site gets, compared with the clicks that go to all results for your tracked keywords.
It depends on the keyword list you chose.
Steps for both search methods: the formula guide. For AI answers: share of voice measurement.
Share of Voice in Google Ads: Impression Share
In Google Ads, the metric is impression share.
The impressions your ads received. Divided by the estimated impressions they were eligible to receive. (Google.)
You get it for campaigns, ad groups, product groups in Shopping campaigns, and keywords. For Performance Max, Google counts Search and Shopping impressions together.
Add these columns to the campaign table:
| Column | What it tells you |
|---|---|
| Search impression share | Impressions received ÷ eligible impressions on the Search Network |
| Search lost IS (budget) | How often your ads did not show because the budget was too small. Campaign level only |
| Search lost IS (rank) | How often your ads did not show because of poor Ad Rank |
| Search exact match IS | Impression share for searches that matched your keywords exactly, or as close variants |
| Search top IS | Impressions among the top ads ÷ eligible top impressions |
| Search abs. top IS | Impressions as the very first ad ÷ eligible top impressions |
(Definitions: Google's pages on impression share data and top and absolute top metrics.)
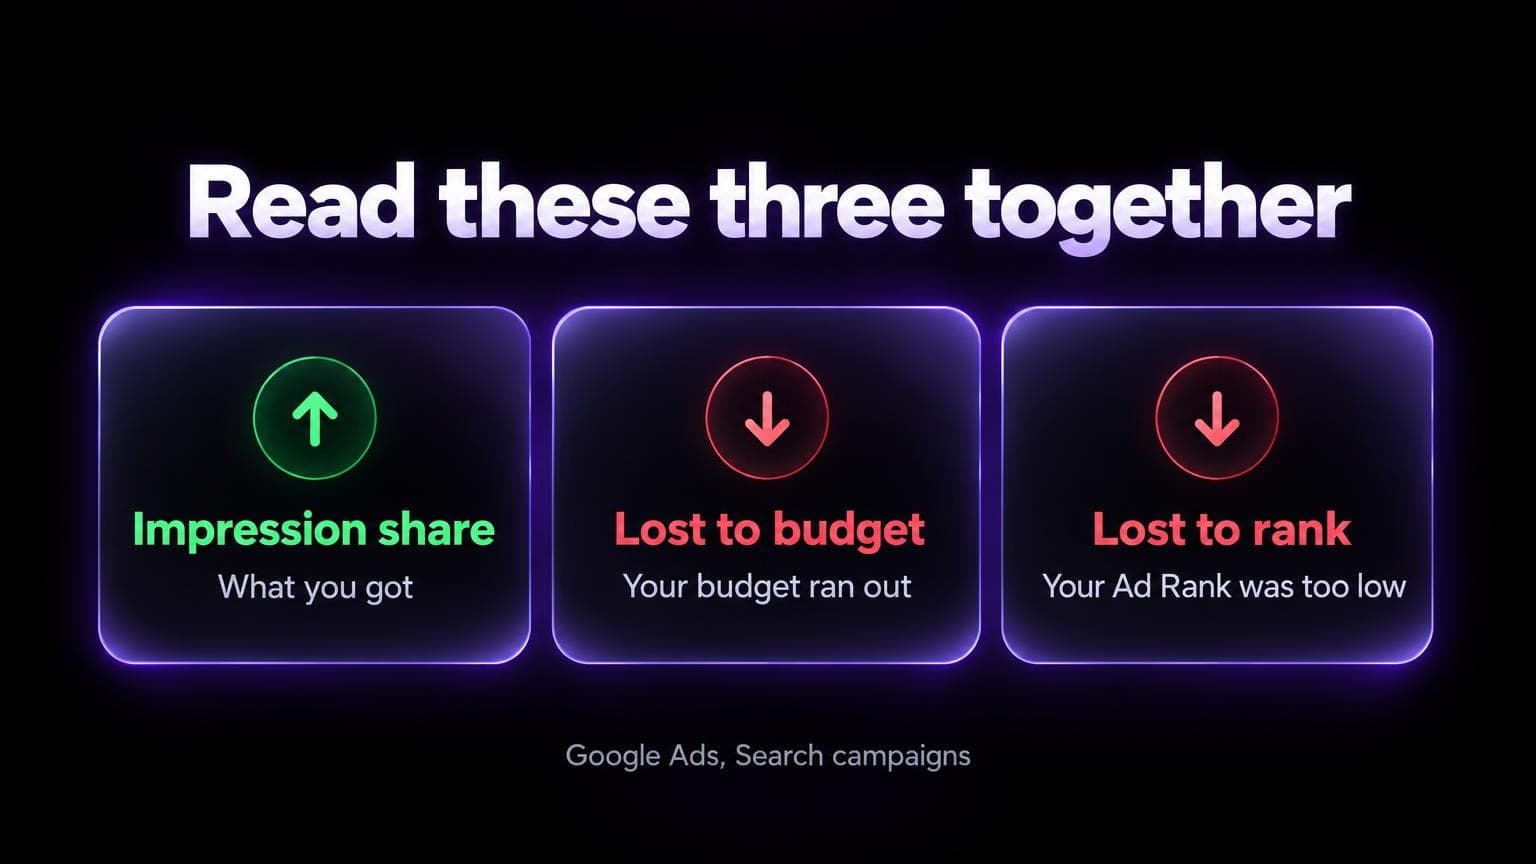
Read the first three together. The share you got. The share you lost to budget. The share you lost to rank.
They point to different repairs.
One more thing: Google reports these per campaign type. Not across the account.
Auction insights: the competitor view
The Auction insights report compares you with the other advertisers in the same auctions.
For Search campaigns it has six statistics:
- Impression share
- Overlap rate: how often their ad showed when yours did
- Position above rate: how often theirs ranked above yours when both showed
- Outranking share
- Top of page rate
- Absolute top of page rate
Google states two limits. No insights when impression share is under 10%. And a minimum level of activity in the selected period.
Microsoft Advertising
Microsoft uses the literal name. Its share of voice report gives impression share for each keyword.
Its report columns define it against the total available impressions in the market you were targeting.
Google says "eligible impressions". So read both definitions before you compare.
Target impression share bidding
Target impression share is an automated bid strategy. You select a placement and a percentage. Google sets the bids.
Google's own example: a brand campaign with a target of 100%.
I'd use this strategy mainly for brand terms. Its goal is visibility. Not conversions or cost per sale.
Where the Number Misleads
Impression share is an estimate.
It counts the auctions where your ad showed. Plus the auctions where it was competitive enough to show.
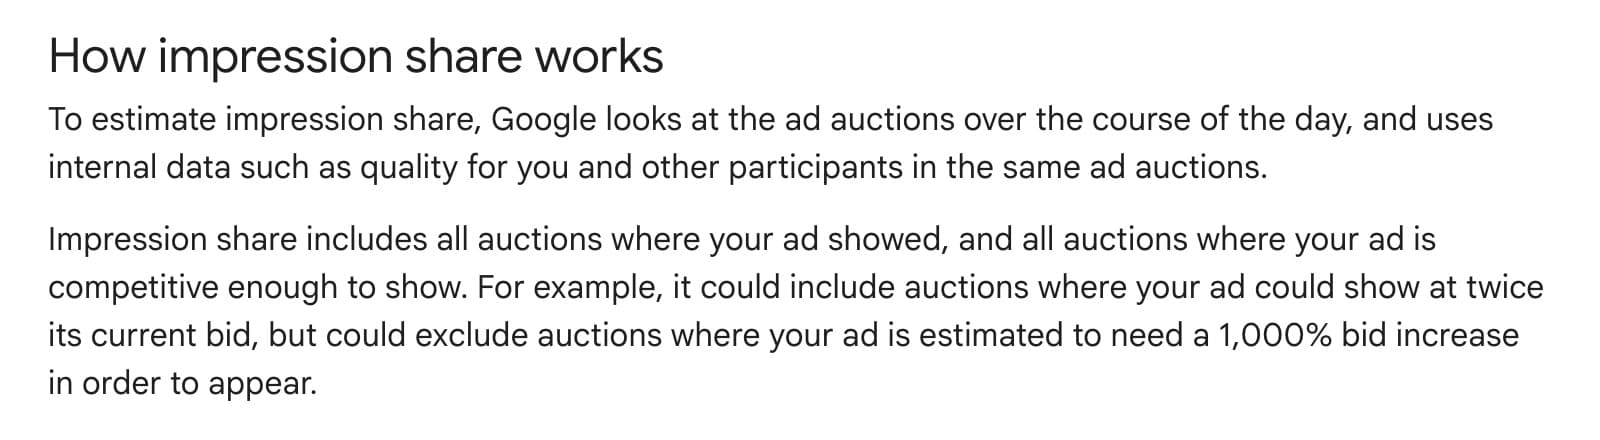
- The total could include auctions where your ad could show at twice its current bid.
- It could exclude auctions where it's estimated to need a 1,000% bid increase.
So 100% impression share is not 100% of the market.
And changes to your bids, your quality or Google's ad systems can change which auctions count.
Three more traps:
The total is yours, not the market's. Google's tips to improve impression share say that decreasing your regional targets can raise impression share while it reduces the impressions available to you. The percentage goes up. Fewer people see the ad.
Competitor rows have different totals. In Auction insights, each advertiser's impression share is a proportion of the auctions in which that advertiser was eligible to show. Google's example: you show 100% while the competitor has 50% in their own eligible auctions.
Search partners are not included. Not in impression share data. Not in Auction insights.

Does AI name you?
See if AI mentions your brand. Then get the pages to fix.
Excess Share of Voice and Market Share Growth
The rule in one line:
Share of voice above your market share? Brands tend to grow. Below? They tend to shrink.
The gap has a name. Excess share of voice, or ESOV.
ESOV = share of voice − share of market
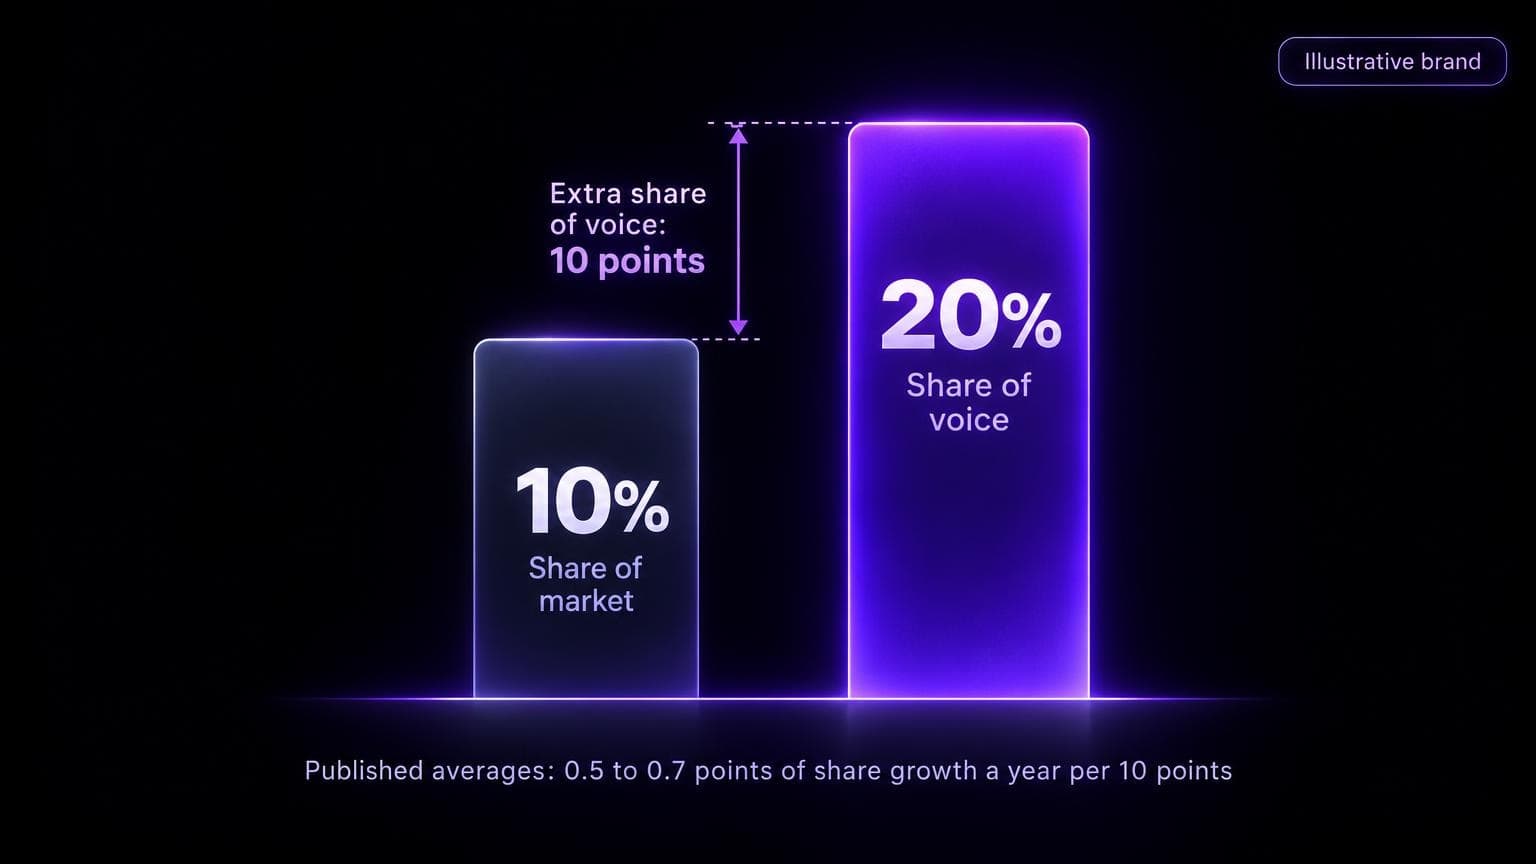
Take the $2 million brand from the top. 20% share of voice. Give it a 10% market share.
Its ESOV is 10 points.
What is that worth? The published averages:
| Source | Data | Growth for each 10 points of ESOV |
|---|---|---|
| Nielsen, 2009 | 123 brands in 30 categories, typical campaigns | 0.5 points of share in a year, a norm for fast-moving consumer goods brands |
| Binet and Field, consumer brands | IPA Databank cases | 0.6 points of share a year |
| Binet and Field, B2B brands | Fewer than 50 B2B cases in the IPA Databank | 0.7 points of share a year |
Two cautions.
First: these studies count category ad spend.
Neither the Nielsen page nor the Binet and Field report mentions Google Ads impression share.
So nothing here shows that a higher impression share grows market share.
Don't subtract your market share from a Search impression share and call it ESOV.
Second: these are averages.
Nielsen reports large variances between categories and brands. Binet and Field call their B2B result tentative. And their data comes from entries to an effectiveness award.
More: share of market vs share of voice.
Advertising Share of Voice Examples
A billboard loop
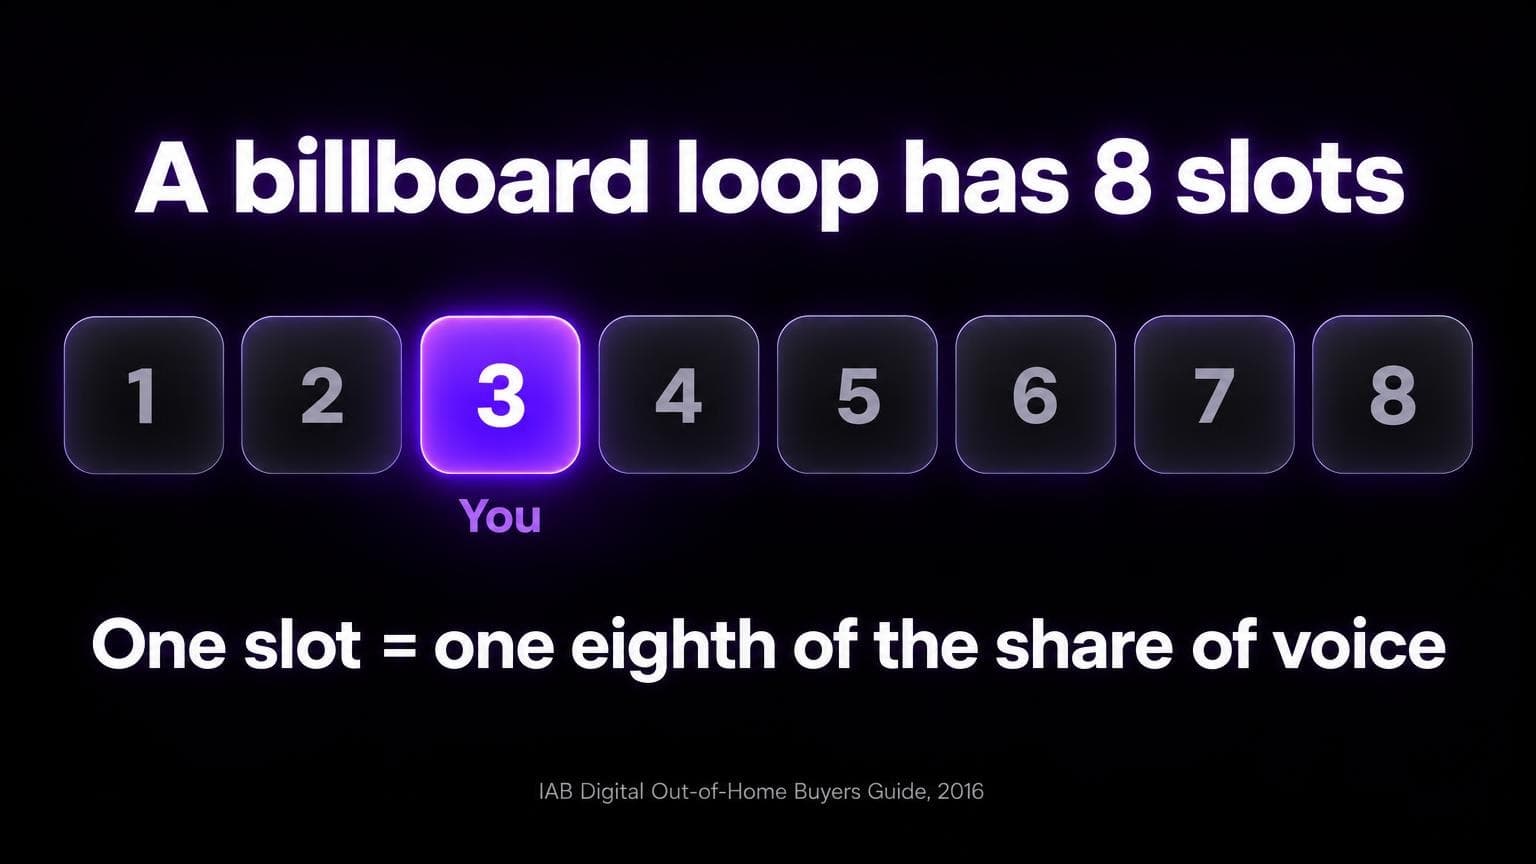
The IAB's Digital Out-of-Home Buyer's Guide (2016) describes a typical digital billboard: eight slots in a loop.
All slots sold? Each advertiser has one eighth of the share of voice.
US furniture retailers
Nielsen's 2025 article covers November 2023 to October 2024.
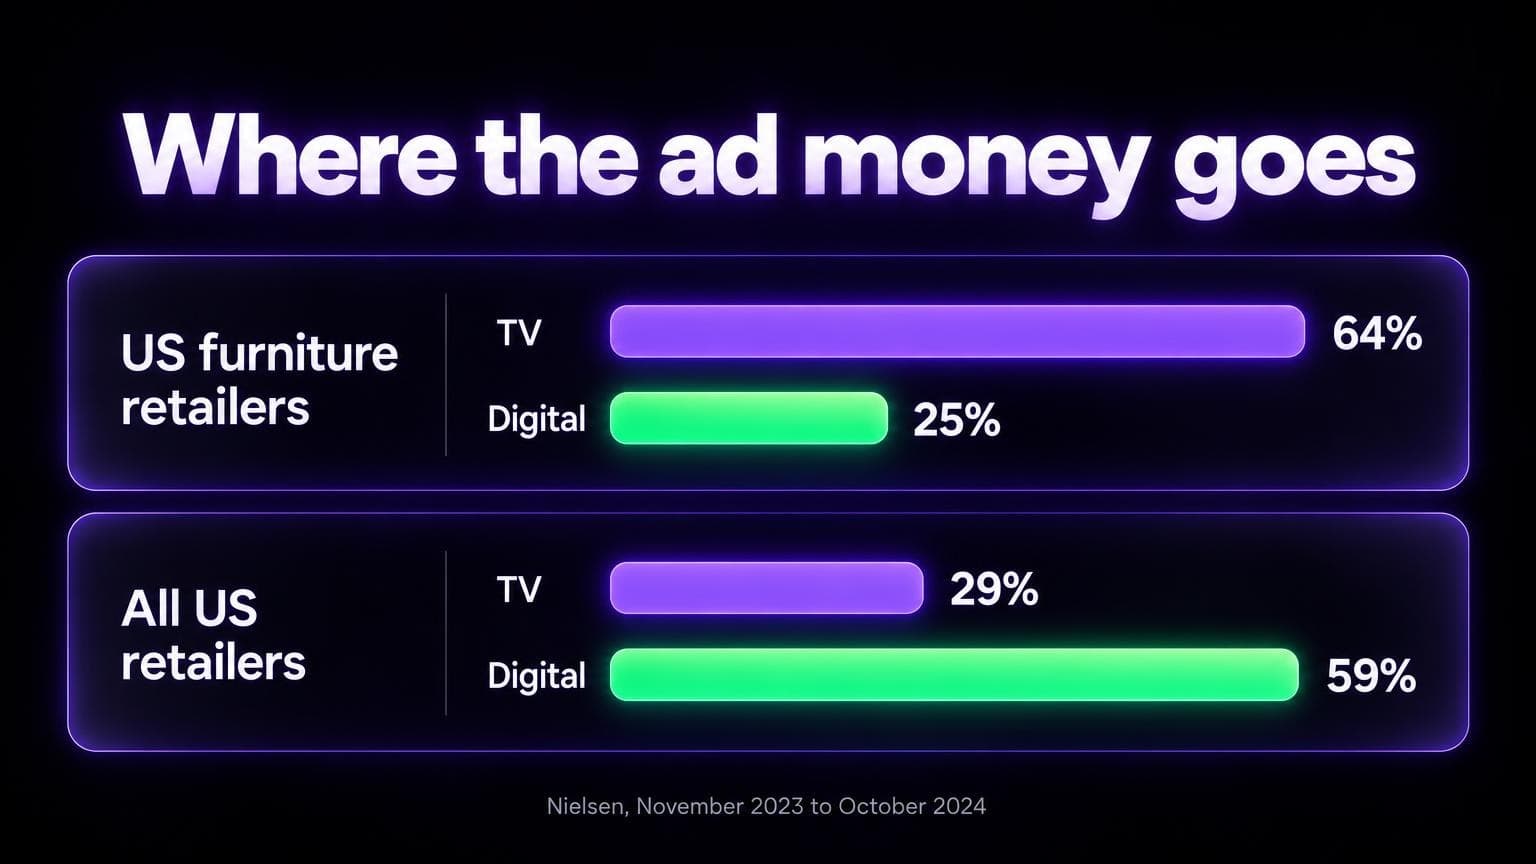
- US furniture retailers: 64% of ad budgets on TV. 25% on digital.
- US retailers on average: 59% on digital. 29% on TV.
Who has the voice?
- Four companies held more than half of furniture media spend in 2024: Wayfair, Sleep Number, Rooms to Go and Ashley Furniture. Nielsen says they had about the same share of voice.
- IKEA was fifth, at 7.8%.
- La-Z-Boy was sixth, at 4.5%.
But look per channel and the leaders change. Sleep Number in audio. Rooms to Go in print. Ashley Furniture in digital and outdoor.
So name the channel when you quote a number.
A B2B budget
LinkedIn's guide turns the B2B number into a budget.
Its example is imagined. A cloud computing brand with 10% of the market and 20% of category ad spend. (The same numbers as the made-up brand in this guide.)
- ESOV: 10 points.
- Worth: 0.7 points of share growth a year.
- To grow 2 points: about 30 points of ESOV. So a 40% share of voice.
LinkedIn says the brand must double its advertising.
Not quite. Here's my arithmetic. Not LinkedIn's.
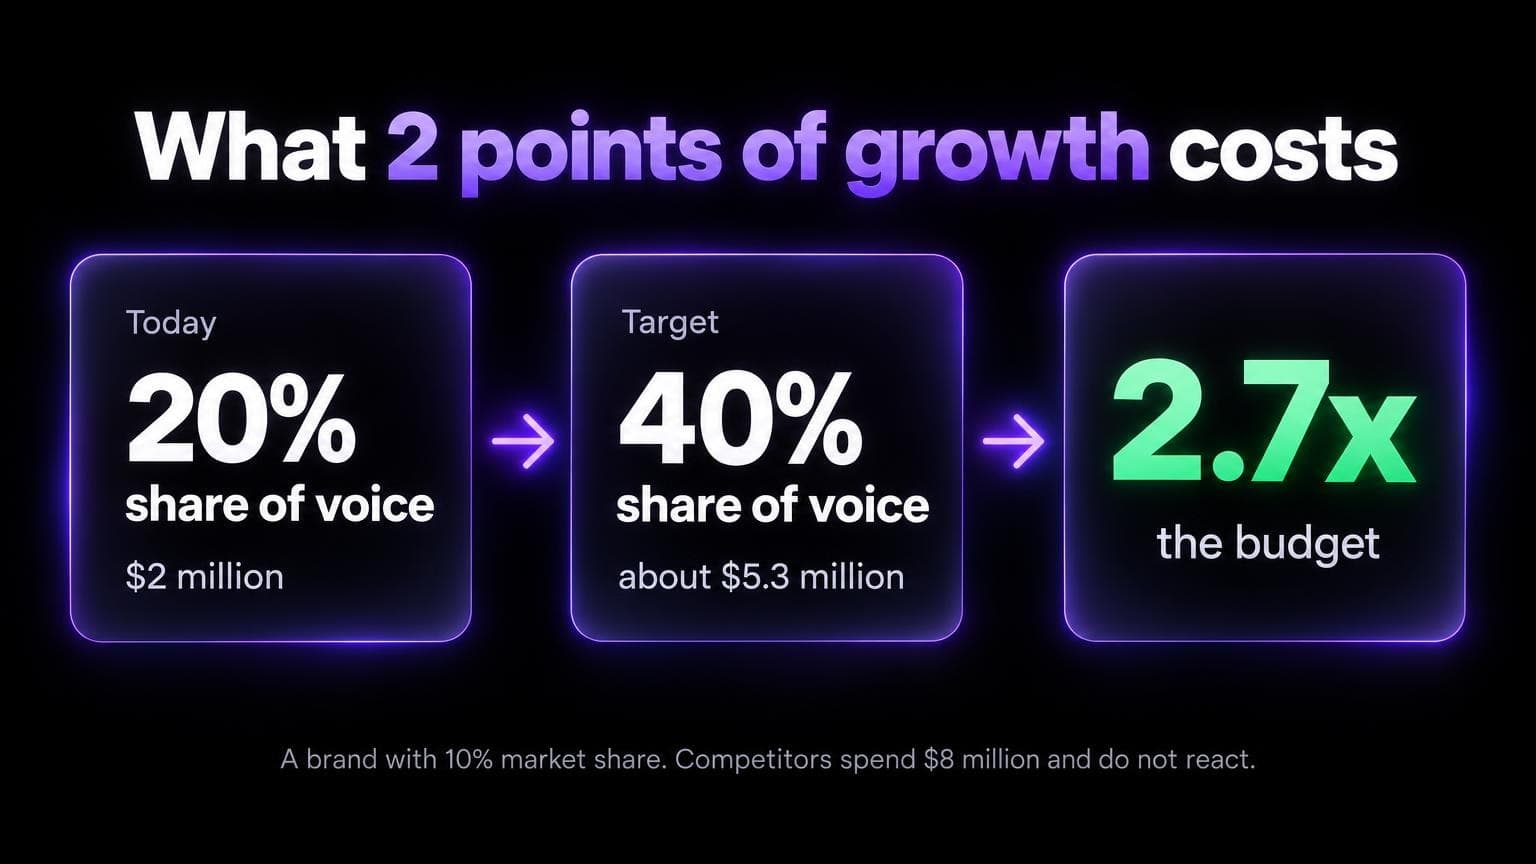
Your own spend is part of the total.
- Competitors spend $8 million. You spend $2 million.
- A 40% share needs about $5.3 million. (5.3 ÷ (5.3 + 8) is about 40%.)
- That's about 2.7 times the budget.
And only if competitors don't react.
How to Increase Your Advertising Share of Voice
Share of voice is a ratio. So you have two moves.
Add to the top number. Or pick a smaller bottom number.
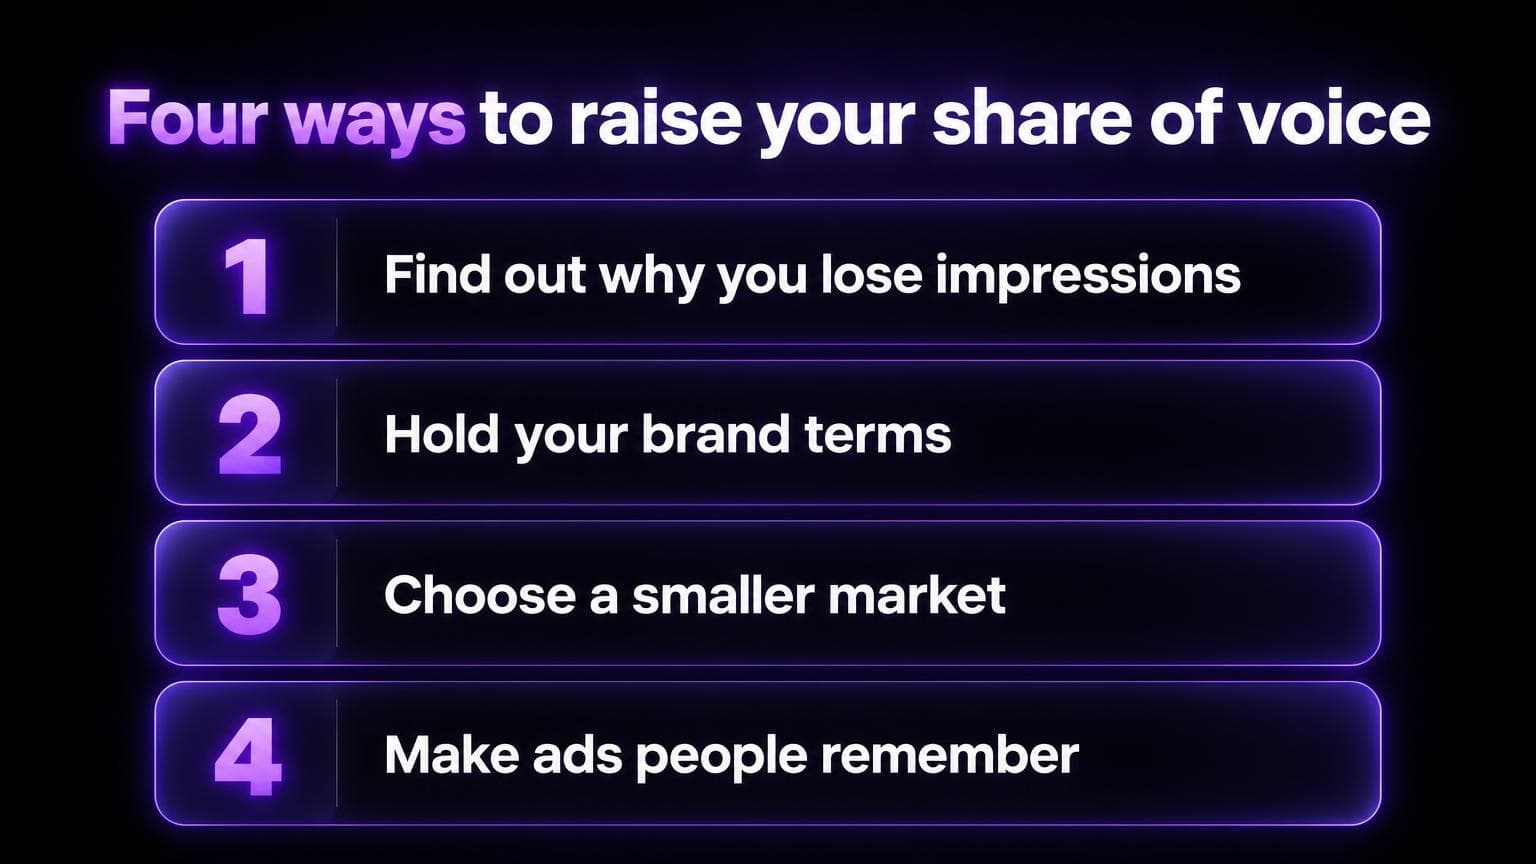
1. Find out why you lose impressions. Read Search lost IS (budget) and lost IS (rank) first. Budget loss needs more budget or a narrower scope. Rank loss is about Ad Rank, which Google calculates from your bid and your ad quality, among other factors.
2. Hold your brand terms. A search for your brand name is the last impression you should lose. Check Auction insights on the brand campaign to see who else shows there.
3. Choose a smaller market. The same budget in one region, one segment or one keyword theme gives a share that buyers can notice. Be honest in the report: the share rose because the market you measure got smaller.
4. Make ads that people remember. LinkedIn's summary of the same research says it is extremely difficult for a small brand to cut through with advertising that is much like the rest of the category.
Then work in three steps:
- Record the baseline. Impression share, lost IS (budget), lost IS (rank), and Auction insights on the brand campaign. Last 30 days.
- Estimate your category position. Share of search. And spend share, if you have a source.
- Set one target and a date. Don't react to a small change.
Common Questions About Share of Voice
What is a good share of voice percentage?
No single percentage is good in every category.
Start with your market share. The published rule says a share of voice above it goes with growth.
For brand terms in paid search, Google's own example uses a target of 100%.
Vendor pages give round numbers. Without a cited source:
- AgencyAnalytics: 25 to 30% is often considered strong.
- Pace Ads: 90% or higher for brand campaigns. 60 to 80% for high-intent non-brand.
What does 50% share of voice mean?
On the classic count: you hold half of the category's ad spend. Not half the market.
In Google Ads: you got half of the impressions in the auctions you were eligible for.
And 100%? You bought every slot, or showed in every eligible auction. It doesn't mean no other advertiser showed next to you.
Is share of voice a reliable metric?
Reliable for what it counts. Which is weight. Not effect.
The studies are averages with wide spread. The B2B result is tentative. Impression share is an estimate.
Use it as one input. Next to market share and sales.
What is the difference between share of voice and share of mind?
Share of voice counts what you send out.
Share of mind is what buyers keep. How readily your brand comes to mind when they're ready to buy.
Binet and Field found that B2B campaigns aiming to increase share of mind were the most effective ones in their data.
Does share of voice apply to AI answers?
Yes. With a different count: brand mentions and citations across a fixed set of prompts.
That has its own guide: share of voice measurement.
AI SEO Tracker scans ChatGPT, Perplexity, Gemini, Copilot and Google AI Overviews for one brand. $49 once, up to 50 prompts, daily for 7 days.