"Share of Voice" (SOV) sounds like another fluffy marketing metric. It isn't.
SOV is a direct indicator of your market visibility against your competitors. But most guides tell you to count brand mentions or estimate ad spend, which is outdated and useless. A high mention count means nothing if everyone is complaining.
This guide gives you a modern, no-BS framework to measure the share of voice that actually connects to revenue.
Why Your Current SOV Metrics Are Probably Wrong

Here’s the hard truth: too many marketers track SOV with methods that have zero connection to real business goals. Simply tallying up brand mentions gives you a vanity metric that leads to bad strategic decisions because the data is hollow.
This old-school approach treats every mention as equal, failing to consider context, sentiment, or actual influence.
The Traps of Oversimplified Measurement
The real danger with simple metrics is the false sense of security they create. You get a number, but it's disconnected from reality.
I see these mistakes all the time:
- Ignoring sentiment: A huge spike in mentions is worthless if it's a PR crisis. You have to separate positive buzz from customer complaints.
- Failing to segment by channel: Your SOV on Google is a completely different beast than your SOV on TikTok. Each channel requires its own measurement and strategy.
- Using a sloppy competitor list: If you track against a different list of competitors every quarter, you can't spot real trends. The data becomes meaningless noise.
The goal isn't to chase a percentage. It's to build a strategic indicator of market presence. A meaningful SOV metric tells you where you're winning and why.
Moving Beyond Vanity Metrics
SOV measurement is getting smarter. We're now seeing a move toward incorporating historical data and more granular tracking. Back in 2022, the analytics platform STAT introduced subfolder and historical share of voice tracking, which was a significant step forward. It let brands measure organic visibility with far more detail.
This update allowed companies to backfill up to six months of data, finally providing decent benchmarks. According to a 2023 survey by the Digital Marketing Institute, over 70% of professionals reported that access to historical SOV data made it easier to forecast campaign outcomes.
This shift underscores the need for a more sophisticated view. Once you understand the pitfalls, you can build a share of voice report that delivers genuine, actionable insight.
First, Define Your Real Competitive Landscape
To accurately measure share of voice, you must first define the arena.
Your competitors are not just the handful of companies in your sales decks. The real competitive landscape is broader, reflecting the actual choices your customers make.
If your competitor list is incomplete, your SOV data will be skewed and useless. A precise landscape is the foundation of meaningful SOV data.
Identify Your Three Types of Competitors
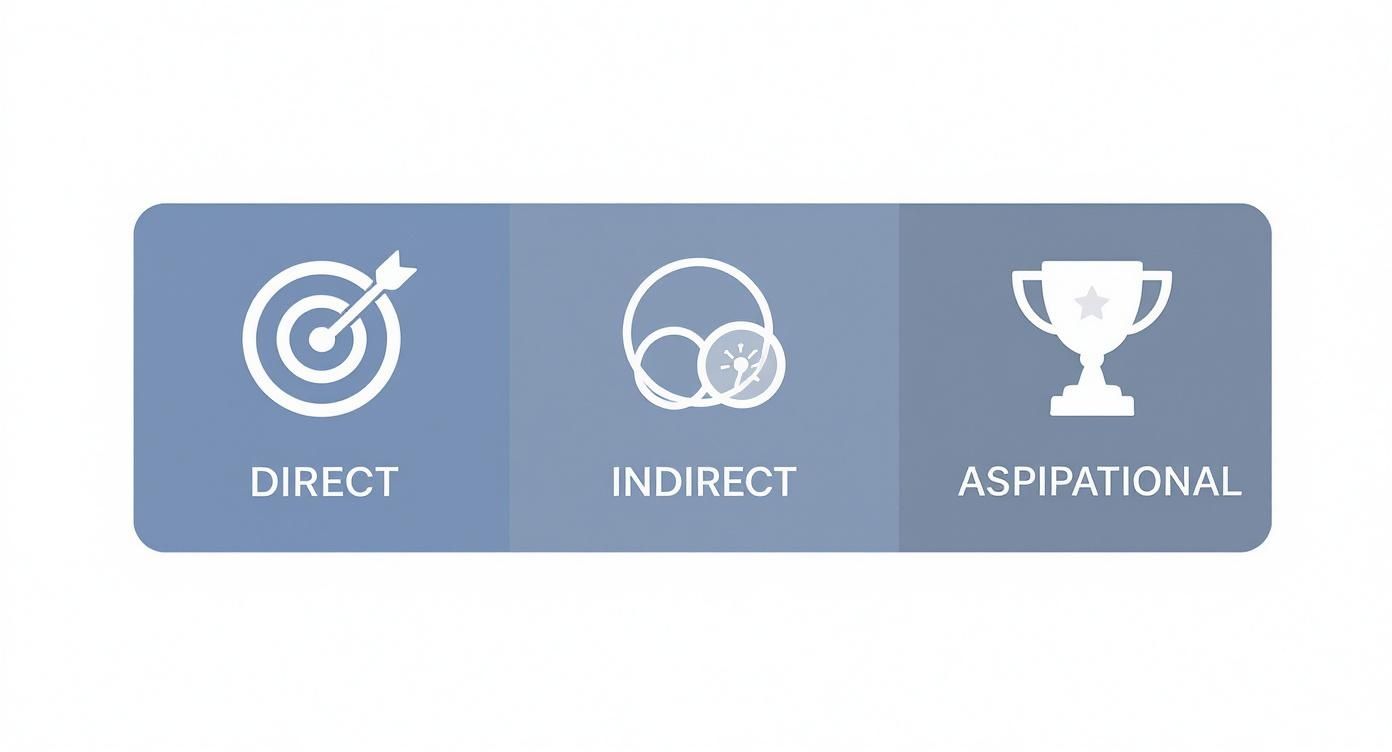
Most businesses only track direct competitors. This view is dangerously narrow. A complete analysis looks at three distinct categories.
- Direct Competitors: The obvious rivals. For Mailchimp, this is ConvertKit and Constant Contact. They solve the same problem for the same people in the same way.
- Indirect Competitors: They solve the same core problem with a different solution. A project management tool like Asana doesn’t just compete with Trello; it also competes with Google Sheets or even communication platforms like Slack.
- Aspirational Competitors: The market leaders you aim to be. A startup might track HubSpot not because they compete on product today, but to understand how HubSpot dominates conversations around marketing education.
Identifying all three types prevents massive blind spots. You might discover an indirect competitor is capturing a huge share of a specific topic, revealing a market need you're not addressing.
Map the Conversation, Not Just Brand Names
With your competitors listed, it’s time to define the conversation topics.
This is critical: you are not just tracking brand names.
You need to track the topics, problems, and keywords your audience uses when they aren't searching for a specific brand. This is how you capture the entire discussion.
For example, a B2B SaaS company selling team collaboration software should build out a keyword map like this:
- Problem-Aware Keywords: "how to improve team productivity," "remote team communication issues"
- Solution-Aware Keywords: "best team collaboration tools," "agile project management software"
- "Jobs-to-be-Done" Keywords: "task tracking for small teams," "sprint planning template"
This approach measures your share of the actual conversation customers are having. It shifts the focus from a brand-vs-brand shouting match to a strategic view of who is winning the discussion around customer problems. You can learn how this applies to paid campaigns in this guide to share of voice in advertising.
Pick Channels and Metrics That Actually Matter
Your share of voice isn't a single universal number. It’s a mosaic, pieced together from different metrics across the channels where your audience spends time.
The trick isn't to track everything. It's to track what genuinely reflects your influence.
A common mistake is blindly chasing "mentions." But a mention isn't just a mention. The real goal is to pick metrics that act as a proxy for market share on a specific channel.
Before you even think about metrics, you have to map out your competitive landscape. It's bigger than you think.
Getting this right stops you from fixating on obvious rivals while an indirect competitor quietly eats your lunch on a channel you're ignoring.
Metrics for Organic Search
For SEO, don't fixate on your rank for one or two vanity keywords.
A much smarter indicator is organic keyword visibility, sometimes called share of search. This metric calculates your visibility based on your ranking positions across a list of strategic keywords, weighted by their search volume.
- Why it's better: Ranking #1 for a term with 10 monthly searches is less valuable than ranking #5 for a term with 10,000. Visibility accounts for this, giving you a truer picture of your SERP presence.
- How to track it: SEO platforms like Semrush or Ahrefs do the heavy lifting. Set up position tracking for a defined set of keywords, add your competitors, and they'll calculate the visibility score for you.
Metrics for Paid Advertising
In paid advertising, the metric you need is built right into platforms like Google Ads: Impression Share.
Impression Share is the percentage of impressions your ads received compared to the total number they could have received. A 40% impression share means you showed up for four out of every ten relevant ad auctions.
This data tells you exactly how much of the paid ad space you capture. It's a direct line to understanding your paid SOV. For a deeper dive, check out our guide to share of voice in advertising.
Metrics for Social Media and PR
On social media, just counting mentions is a recipe for disaster. It's easily skewed by spam, customer service complaints, or irrelevant chatter.
A much stronger approach pairs two key metrics:
- Conversation Volume: The raw count of mentions for your brand, competitors, and key topics.
- Sentiment Analysis: A qualitative layer that tells you if mentions are positive, negative, or neutral.
Together, they paint the real picture. A competitor might have double your mentions, but if 80% are from angry customers, your smaller, more positive share of voice is winning. The same logic applies to PR, where you'd track article volume alongside sentiment.
Different channels have unique nuances. For niche platforms like audio, you'll need to get even more specific. This guide on measuring podcast performance and its business impact is a great example of how to refine your metrics for a specific format.
Your Cheat Sheet: SOV Metrics by Channel
This table outlines the key metrics, calculation methods, and recommended tools for measuring your Share of Voice across common digital channels.
| Channel | Primary Metric | Calculation Example | Recommended Tools |
|---|---|---|---|
| Organic Search | Keyword Visibility/Share of Search | (Your brand's clicks / Total market clicks) for a keyword set | Ahrefs, Semrush, Moz |
| Paid Search | Impression Share | (Your impressions / Total eligible impressions) x 100 | Google Ads, Microsoft Ads |
| Social Media | Conversation Volume & Sentiment | (Your brand mentions / Total industry mentions) x 100 | Brandwatch, Talkwalker, Sprout Social |
| PR/Media | Media Mentions & Sentiment | (Your media articles / Total competitor articles) x 100 | Cision, Muck Rack, Meltwater |
| Content Marketing | Branded Search Volume | Your brand's monthly search volume vs. competitors' | Google Trends, Semrush |
| Video | Share of Views | (Your channel views / Total competitor views) x 100 | YouTube Analytics, VidIQ |
Choose your channels wisely, and you'll get a clear, actionable view of your market position.
The Modern Toolkit for Measuring SOV
Theory is great, but practical application is better.
Tracking share of voice manually is a painful process. The right tools automate the heavy lifting, turning raw data into clean, actionable dashboards that show exactly where you stand.
Setting up these platforms correctly is the difference between getting a firehose of useless noise and uncovering genuine market insights.
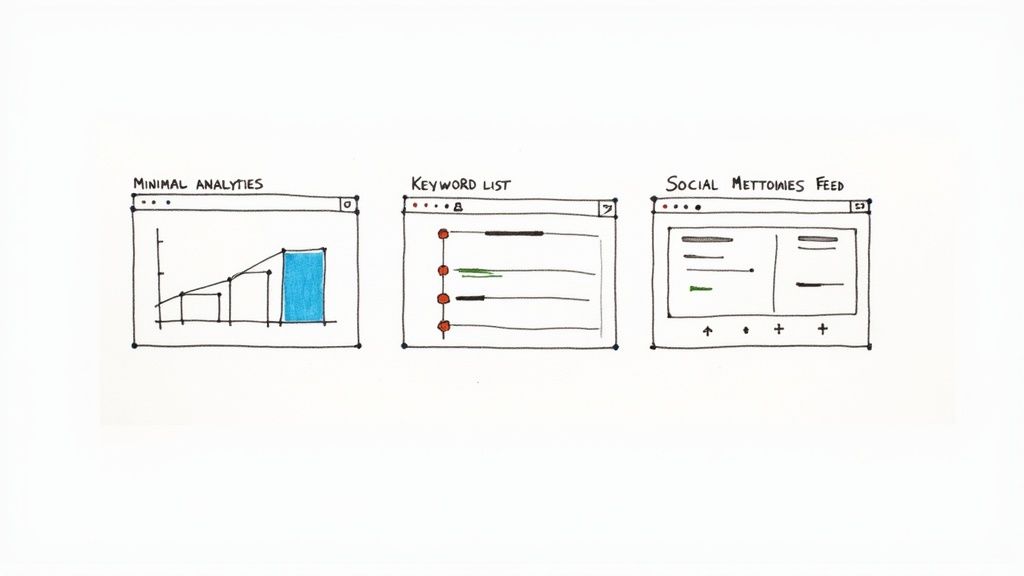
This is what you're aiming for—an immediate, visual check of the competitive landscape. You can see in a second who's dominating the conversation.
Tools for Social and Media Listening
To track conversations on social media, forums, and news sites, you need a dedicated listening platform. Tools like Brandwatch or Talkwalker do more than count mentions; they analyze sentiment, spot trends, and follow conversations as they happen.
The secret to making these tools work is the precision of your queries. A lazy query will drown you in irrelevant noise. A sharp one delivers clean, relevant data.
Pro Tip: Don't just track your brand name. Get granular. Include common misspellings, product names, key executive names, and campaign-specific hashtags. Then, do the same for your top competitors for a true side-by-side comparison.
This shift from ad-spend calculations to tracking digital chatter is critical. As far back as 2015, research showed brands using social listening for SOV were 25% better at responding to market trends. One electronics giant, for instance, calculated its SOV by tracking its 1.2 million brand mentions against a total market conversation of 3.75 million mentions. You can read more about this on Sprinklr's blog.
Tools for Organic Search Visibility
For measuring share of voice in organic search, SEO platforms like Semrush and Ahrefs are your go-to. They go beyond simple rank tracking to calculate a "visibility score" based on a set of keywords you define.
This metric is powerful because it weighs your rankings by the search volume of each keyword. Ranking #1 for a term with 50 monthly searches means less than ranking #3 for a term with 50,000 searches.
Here’s a real-world B2B tech company setup:
- Define Keyword Baskets: Create separate lists for high-intent keywords ("best CRM for startups"), mid-funnel keywords ("how to improve sales pipeline"), and branded keywords.
- Plug in Competitors: Add the domains of your top direct and indirect competitors to the position tracking tool.
- Track Visibility Over Time: The platform will then generate a trend line showing your visibility percentage compared to everyone else for each keyword basket.
This setup reveals not just your overall SOV, but exactly where you’re winning or getting crushed. Maybe you dominate high-intent terms but are invisible in mid-funnel content. That's a huge content gap you can now fix. For more on this, explore the most accurate AI visibility metrics software.
How to Turn SOV Data Into Smarter Decisions
Collecting share of voice data is just the starting line.
The real value comes when you turn those numbers into marketing decisions that drive growth. Think of your SOV report less like a trophy and more like a map—one that points to competitor blind spots and market opportunities.
An SOV report answers critical business questions that gut feelings can't. It tells you if your last campaign actually moved the needle on your market presence.
Mini Case Study 1: The E-Commerce Pivot
An e-commerce brand specializing in sustainable home goods tracked its SOV across social platforms. One quarter, they noticed a direct competitor’s SOV surging on TikTok, a channel they had deprioritized.
Digging in, they found the competitor wasn't just posting ads; they were riding a wave of user-generated content around the trend "eco-friendly kitchen swaps." The conversation was exploding, and their competitor was owning it.
Instead of panicking, the brand acted. They quickly launched their own TikTok campaign focused on that exact trend, partnering with micro-influencers.
The result? Within six weeks, they not only reclaimed their share of the conversation but also saw a 15% lift in sales for their kitchen goods category. This wasn't a lucky guess; it was a direct result of turning SOV data into swift, strategic action.
Mini Case Study 2: The B2B Content Gap
A mid-sized cybersecurity firm noticed their organic SOV for "data breach prevention" was a paltry 4%, while a larger competitor held a 35% share.
Instead of trying to compete head-on with generic blog posts, their SOV tool revealed a specific sub-topic where the competitor was weak: "data breach prevention for small businesses." The conversation volume was high, but the top-ranking content was generic and targeted at enterprises.
They saw the gap and launched a targeted content blitz: a detailed guide, a webinar, and three case studies all focused on that specific niche.
Within three months, their SOV for that niche topic jumped to 60%, and they generated 400+ marketing qualified leads directly attributable to the new content. They didn't win the whole war, but they won a crucial, profitable battle.
Your Top SOV Questions, Answered
Measuring share of voice often brings up a few common questions. Let's clear them up.
The biggest challenge isn't the calculation; it's consistency. Your SOV is a relative metric, so keeping your list of competitors, keywords, and channels stable over time is the only way to track meaningful trends.
How often should I measure SOV?
Find the right balance between real-time data and the bigger strategic picture.
- Weekly Check-ins: Ideal for fast-moving industries or during a major campaign launch to make quick pivots.
- Monthly Analysis: The sweet spot for most businesses. It’s frequent enough to catch trends but not so frequent that you’re overreacting to daily blips.
- Quarterly Reviews: Perfect for high-level strategy. This longer timeframe smooths out the noise and shows major market shifts.
The right cadence depends on your industry’s sales cycle. A B2C e-commerce brand might track weekly, while a B2B SaaS company will get more value from monthly or quarterly reports.
What is a good share of voice?
The honest answer: it depends entirely on your market.
There is no magic number. In a crowded market, a 10% SOV could make you a dominant leader. In a duopoly with one major competitor, you should aim for 50% or more.
Instead of chasing an arbitrary percentage, focus on two things:
- Growth: Is your SOV trending upwards over time? Consistent growth is a better sign of success than a static number.
- Market Share: A good rule of thumb is that your share of voice should be higher than your share of market if you want to grow.
Can a small brand compete on SOV?
Absolutely. Small brands can't outspend giants everywhere, so they have to get strategic.
Instead of fighting for broad, expensive keywords, a startup can find a niche conversation and own it. If you're just starting, it's worth reading a comprehensive guide to Share of Voice to nail the fundamentals.
Focus on a specific channel or topic where you can realistically win. A small B2B software company could decide to own the SOV on LinkedIn for the topic "AI for small business accounting." By creating laser-focused content and engaging in that one spot, they could hit a 70% SOV within that niche—even if their overall market SOV is less than 1%.
Ready to see your brand's true share of voice in AI-generated answers? AI SEO Tracker shows you exactly where you and your competitors appear across ChatGPT, Gemini, and more. Stop guessing and start winning the conversations that matter. Discover your AI rankings today.